Boost Call Center Performance with 3CX Competitive Wallboard: Real-time Agent Rankings and Motivation
Keep your team motivated with a live view of agent performance and rankings in one easy-to-read dashboard.
3CX Competitive Wallboard helps managers spot top performers and track progress toward goals without constantly checking reports. Agents can also see how they’re doing in real time making it easier improve throughout the day. Because everything updates live, your team always knows where they stand whether they’re chasing quotas, improving response times, or aiming for the top spot on the leaderboard.
Simple, visual, and easy to follow, it’s a practical way to keep your call center engaged and moving forward.
The 3CX Competitive Wallboard gives your team a live leaderboard that shows how agents are performing throughout the day, week, and month. Managers can choose which stats to display and set team goals that match their workflow. This makes it easier to recognize strong performance and spot trends early. Agents only see the shared leaderboard information, so personal data stays private while still giving everyone a clear idea of how they compare and where they can improve.
Over time, the wallboard also helps managers track performance trends and make smarter decisions based on real activity, not guesswork.
Identify top-performing agents who have achieved the highest call volume and recognize diligent agents who have met their call targets for the current month, week, and day.
MANAGEMENT VISIBILITY
Gain valuable insight into your team’s productivity as a manager. Identify top performers and those in need of support instantly, empowering you to optimize performance and make informed decisions in real-time.
ENHANCED ACCOUNTABILITY
Access tangible and practical data instantly, enabling informed decision-making based on crucial performance metrics.
AGENT STATUS
Monitor the availability and duration of phone status changes in real-time.
IIS is needed as a web server to host and manage web-based applications and services.
.NET Framework 4.7.2 (Web Installer)
This framework provides essential components for running and developing applications.
.NET Core SDK.
.NET Core SDK is required for development and deployment purposes. It provides the necessary tools, libraries, and runtime environment for building and running .NET Core applications. and allows developers to create custom integrations, plugins, or extensions for the 3CX system. Click here to download the application and install it in the VoIPTools server.
VoIPTools Universal Updater
This component is necessary for updates, ensuring the application remains current and functional.
VoIPTools Relay Service
It is used for proper integration and functionality of the 3CX Competitive Wallboard within the 3CX environment.
Microsoft SQL Server 2016 or above (Including the free SQL Express edition)
3CX requires Microsoft SQL Server 2016 or later for database management.
Minimum of 8GB RAM
Sufficient RAM ensures smooth performance and efficient operation of the 3CX Competitive Wallboard software, especially when handling large amounts of data.
Static IP for VoIPTools and 3CX servers
This is to ensure proper two-way communication, both the 3CX server (Relay) and the VoIPTools server. Dynamically assigned IP addresses are not supported. Additionally, it is recommended to use HTTPS for secure communication, which requires a FQDN for SSL/TLS certificate validation between the VoIPTools server and the Relay.
Port number 7250 opened on your device
Port 7250 is a specific network port used by 3CX for communication purposes. Opening this port on the device’s firewall allows incoming and outgoing traffic to pass through, enabling the 3CX software to send and receive data over the network effectively.
NOTE:
Installation on a domain controller may require additional assistance
When installing SQL Server, we recommend you install it in “Mixed Mode” to include SQL Authentication, and install SQL Management Studio
When installing IIS, be sure to install Basic Authentication, .Net Extensibility, and ASP.Net 4.X
You can order 3CX Competitive Wallboard online at https://www.voiptools.com. Your order confirmation email will include your license key and a link to download the software.
INSTALL PREREQUISITES
You must install several prerequisites before installing the 3CX Competitive Wallboard. The Advanced Installer identifies and installs these applications automatically. Click here to learn about the required prerequisites.
INSTALL 3CX COMPETITIVE WALLBOARD
This User Guide contains step-by-step instructions to successfully install 3CX Competitive Wallboard. Begin by extracting the installer from the downloaded zip file, then run the setup program named CompetitiveWallboard.exe
LOG INTO THE WEB APPLICATION
You can now log in to the web application using the extension number and the PIN.
Click on the software installer that was downloaded in step 1 above. The installation wizard will automatically identify the needed prerequisites and assist you with the install of the prerequisites needed to run ‘3CX Competitive Wallboard’. These include .NET Framework (Web Installer), SQL Server Express (Web Installer) and, SQL Server Management Studio.
Click the downloaded installer executable to launch the Prerequisites Setup Wizard and click Next.
Figure 1: Prerequisites Setup Wizard
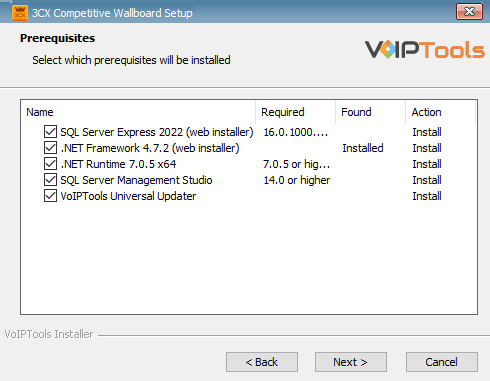
In the Prerequisites window, the installer will identify the missing prerequisites. It is important that you install all the required prerequisites. However, you can select/unselect the applications to be installed based on your unique requirements. Click Next to continue.
Figure 2: Select Prerequisites to Install
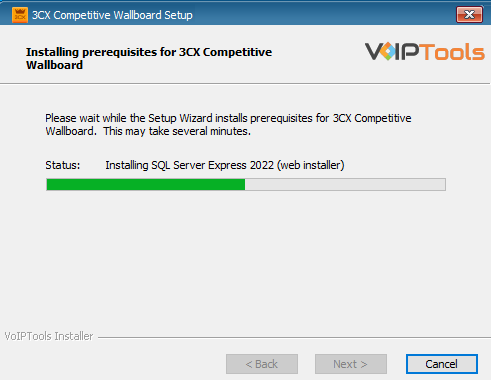
The installer will download and install the selected applications.
Figure 3: Prerequisites installation in Progress
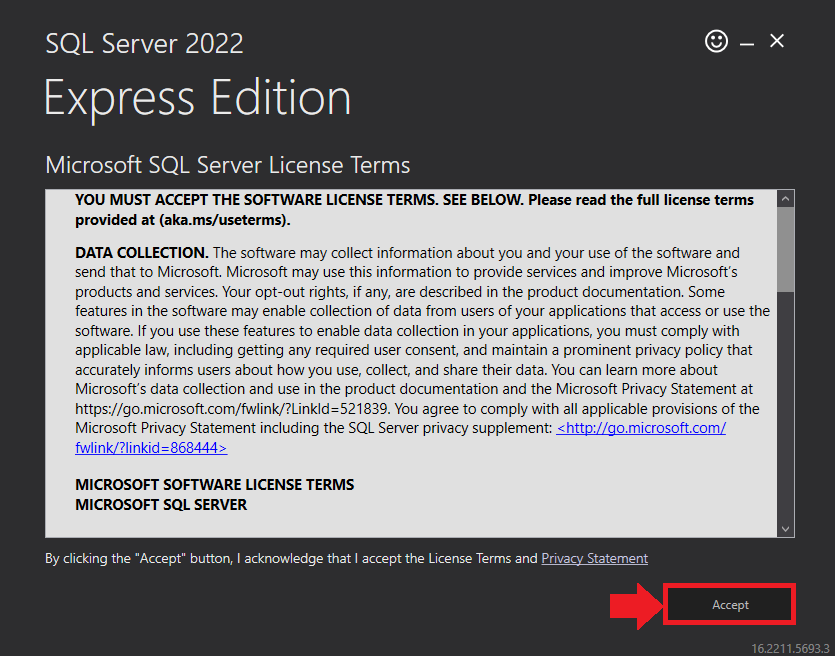
In the Microsoft SQL Server License Terms click the Accept button to acknowledge the license terms and continue.
This page appears if you do not have SQL Server Express preinstalled in your device.
Figure 4: SQL Server Express: Accept License Terms
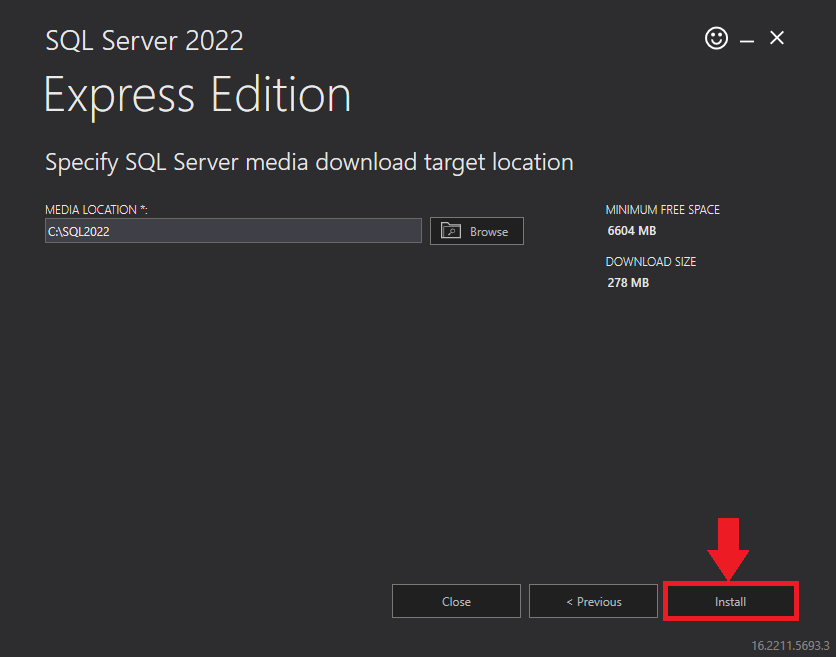
View the SQL Server Media target location in the Media Location field. If required, you can click the Browse button to change the location. Click Install to begin the installation of SQL Server Express.
Figure 5: SQL Server Express: Target Location
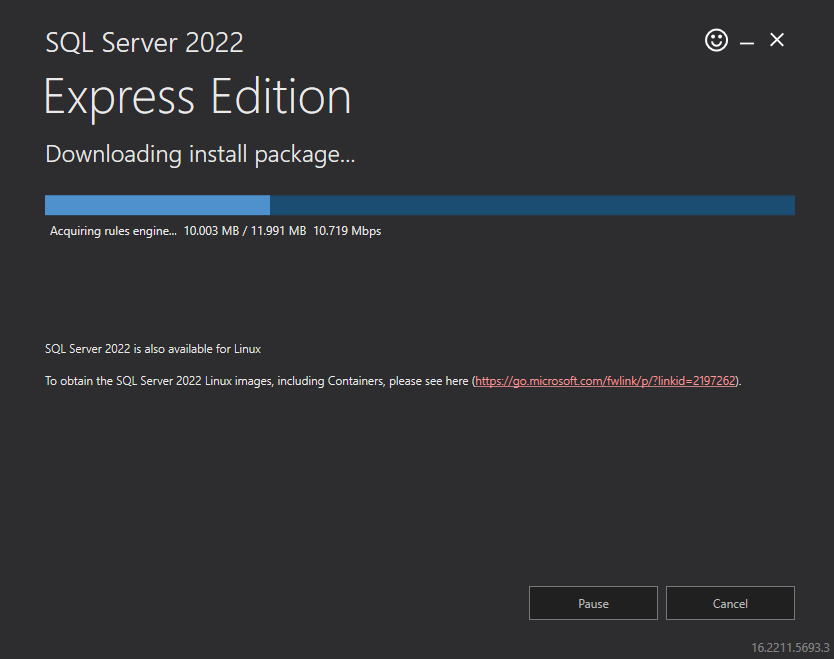
SQL server installation is in progress. This may take several minutes to complete.
Figure 6: SQL Server Installation In Progress
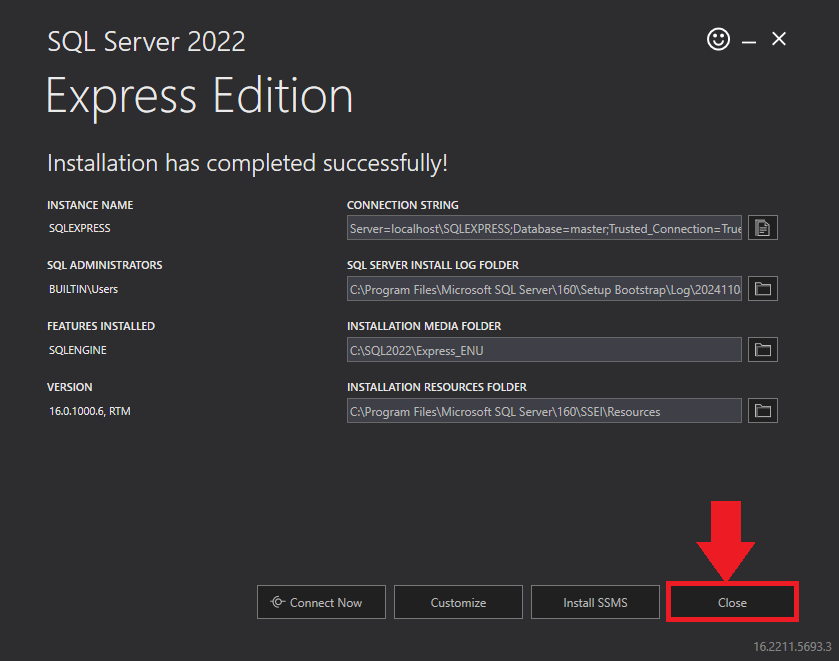
Click the Close button once the prerequisites are installed.
Figure 7: SQL Server Express: Installed Successfully
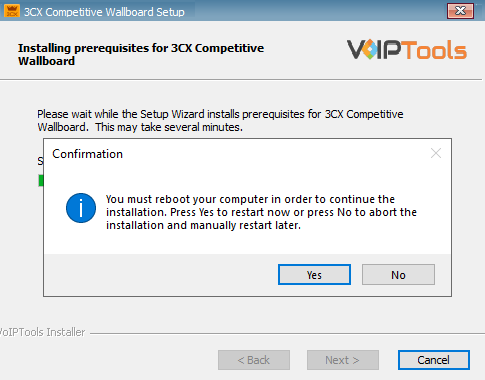
During the installation of SQL Server Management Studio, you will again be asked to reboot your computer. Click Yes to reboot the computer.
Figure 9: SQL Server Management Studio: Reboot your computer
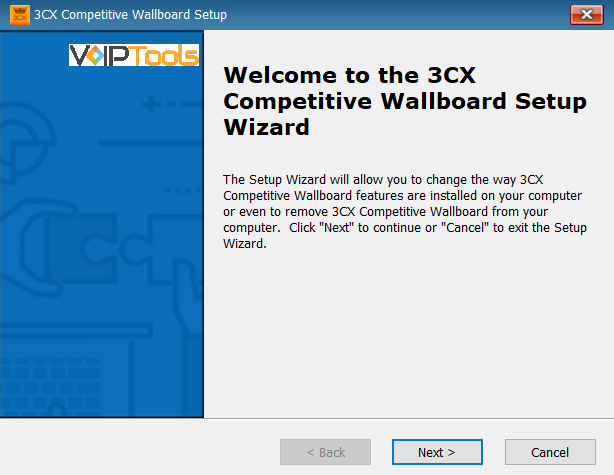
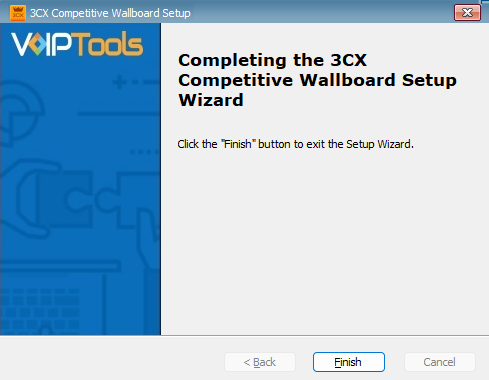
After all the prerequisites are installed, the 3CX Competitive Wallboard Setup Wizard appears. Click Next to Continue.
Figure 10: 3CX Competitive Wallboard Setup Wizard
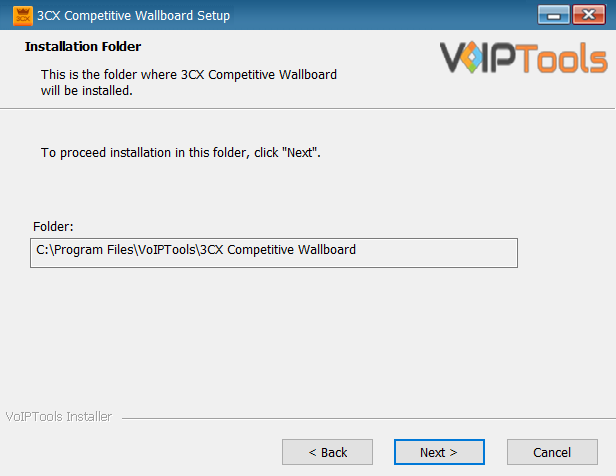
On the Select Installation Folder window, the Folder field displays the location where the ‘3CX Competitive Wallboard’ will be installed. Note that you cannot change the path.
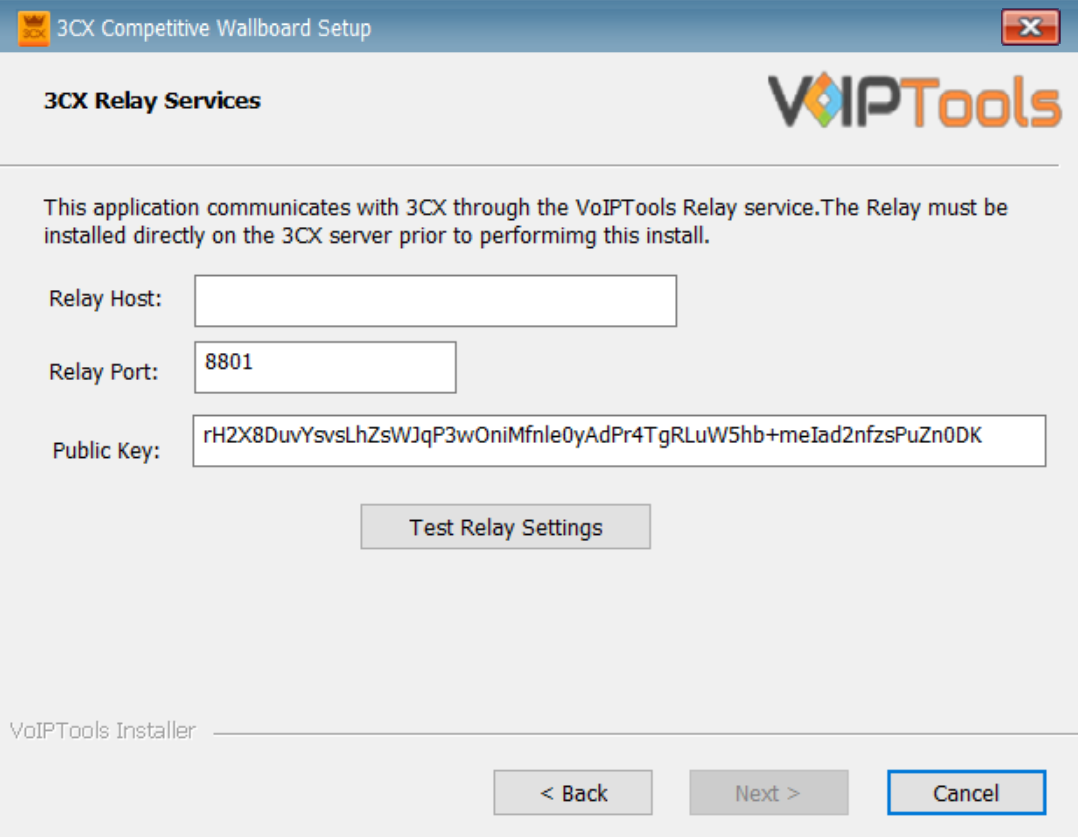
In the 3CX Relay Services window, in the Relay Host field, enter the FQDN of your 3CX server.
Enter 8801 in the Relay Port field.
Enter the public key you took from VoIPTools Relay services in the Public Key text area.
Figure 12: Configure Relay services
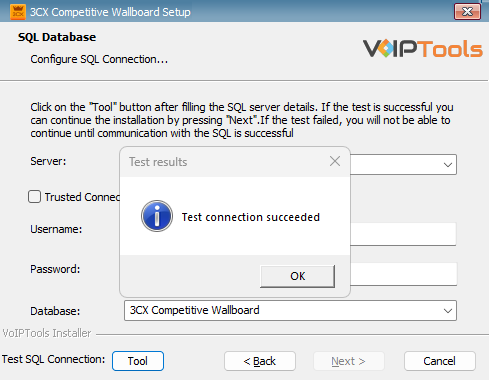
Click the Test Relay Settings to confirm ‘3CX Competitive Wallboard’ can communicate with the Relay services running on the 3CX server.
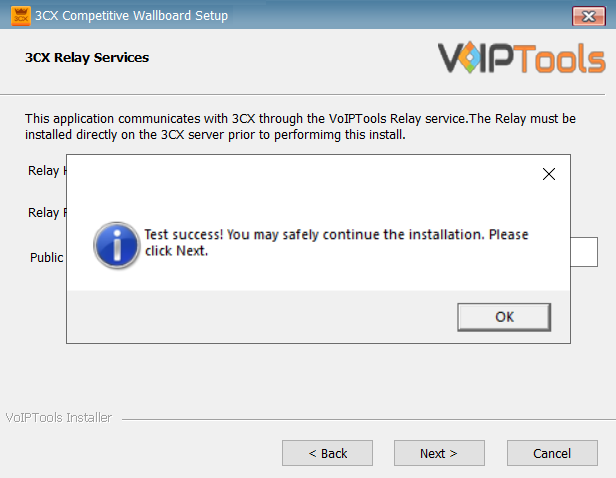
If the ‘3CX Competitive Wallboard’ is successfully able to communicate with the Relay services that run on the 3CX server, a Success message box appears. Click OK. If the test fails, you will not be able to continue until communication with the relay is established.
Click Next to continue with the installation.
Figure13: Test Relay Success
NOTE:
You must set the Relay Port to 8801.
If the Relay test fails, you cannot continue the installation until you establish communication with the Relay. If the test was unsuccessful,
Confirm you have the correct firewall port open (default TCP 8801) on the 3CX server and the firewall protecting the 3CX server.
Confirm that you have entered the correct FQDN for the 3CX server.
Confirm that the 3CX Auto Logout and Relay use the same port and protocol.
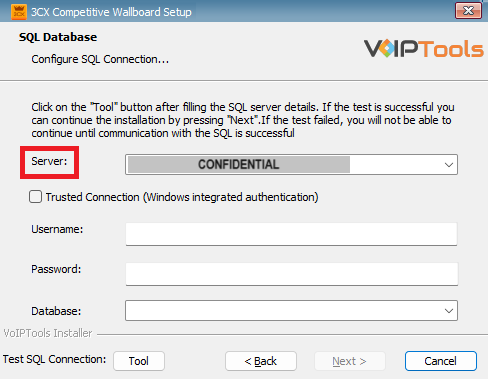
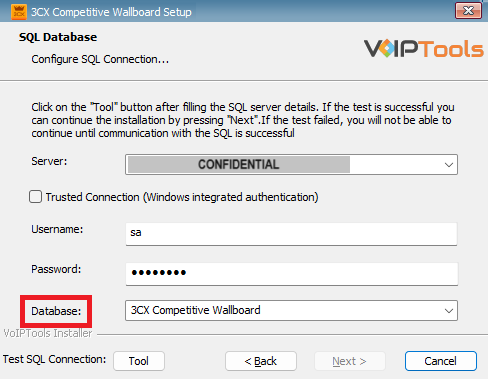
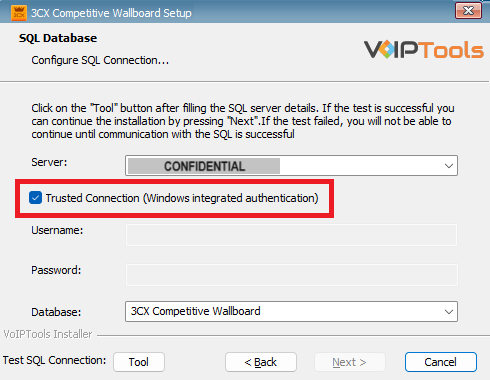
When configuring the 3CX Competitive Wallboard, select an existing Microsoft SQL Server instance in your environment. The database server can be a remote SQL Server, or a local instance running on the VoIPTools server.
You can set up the SQL database using SQL Authentication or Windows Integrated Authentication.
If using the free SQL Express Edition, the default SQL Instance name is SQLExpress.
Figure 14: Configure Database – Server Dropdown
NOTE:
If you want to use ‘SQL Authentication’, then install SQL Server in ‘Mixed‘ mode.
If SQL Server is installed on a server other than the server where 3CX Exporter is installed, you will need to configure SQL Server to allow remote connections.
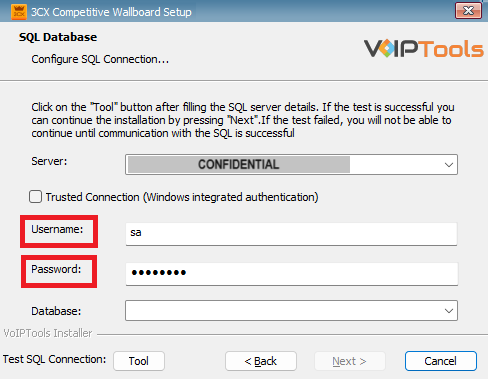
Enter your credentials in the Username and Password fields.
To use Windows Integrated Authentication check the Trusted Connection (Windows integrated authentication) checkbox.
The VoIPTools installer will create a local Windows user name as “VoIPToys” and give you sufficient rights to this user to create/update the SQL database.
We encourage you to use SQL Authentication rather than Windows authentication. Many of our tools leverage a Call Flow Designer (CFD) application running on the 3CX. Frequently our CFD applications require access to a SQL database. If the 3CX server and the database server are not in an Active Directory domain, Windows authentication will fail. To use SQL authentication, your SQL Server must be configured to run in “Mixed Mode”. If you installed SQL Server with one of our tools, we configure SQL in “Mixed Mode”.
Follow the procedure to log in to the web application
Double-click the 3CX Competitive Wallboard desktop icon to open the web application.
On the Login page, do the following tasks,
In the Extension field, enter your 3CX extension number.
In the PIN field, enter your 3CX voicemail PIN.
Click the Login button to log in to your account.
Figure 23: 3CX Competitive Wallboard – Web Portal Login
NOTE:
When you first install the Wallboard, all users are treated as a “managers”. This gives you access to the settings pages where you configure the Wallboard extension group. The name of the 3CX extension group can be anything you choose, and managers of this extension group then become managers of the wallboard.
Once the extension group is created in 3CX and configured in the Wallboard, then you must be a member of this extension group to access the wallboard, and you must be a manager of this extension group to make changes to the wallboard configuration.
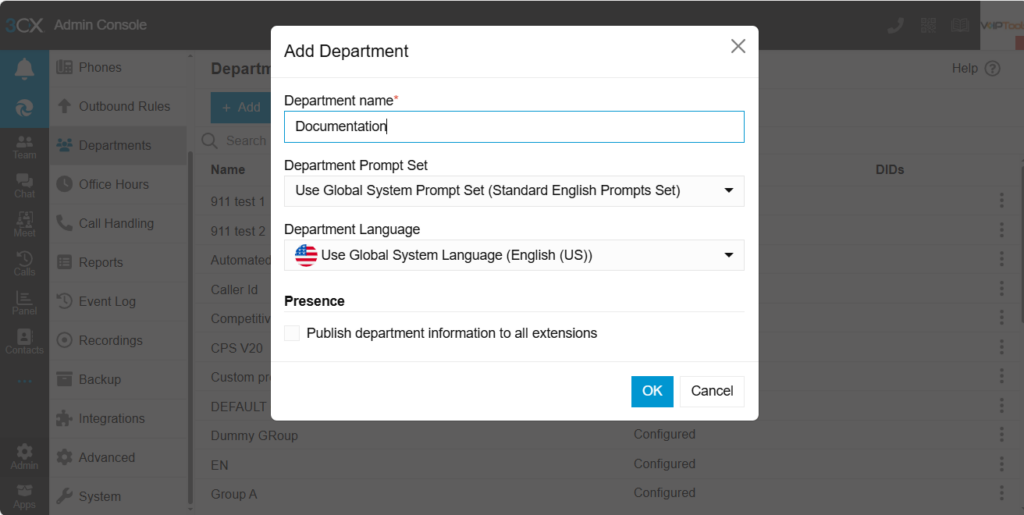
In the Settings section and from the Default Departmet Name dropdown list, select the desired extension group name you want to set as the default one. Click here to learn how to create a new extension group in 3CX.
NOTE:
You cannot view the _DEFAULT_ and Favorite groups created in 3CX Competitive Wallboard.
In VoIPTools applications, the _Default_ Group has been intentionally excluded from the group selection list. In 3CX, the Default Group includes all members of the system. While this works fine for smaller environments, importing all members from the Default Group in larger systems can lead to performance issues
Figure 25: General Tab – Default Department Name Dropdown
NOTE:
You can view all the tabs if you are either a manager of any groups in the 3CX Console Management or have admin rights to the 3CX Console Management.
To access the 3CX Competitive Wallboard web portal, click the Web Portal button on the configuration program, or click on the desktop icon that was created during the installation process (3CX Competitive Wallboard Web).
3CX Competitive Wallboard lets users log in as Agents and as Managers. Separate logins for agents and managers serve to control access, bolster security, customize experiences, enforce accountability, and streamline usability. This approach restricts unauthorized access, safeguarding sensitive functions. Managers, who often require more advanced privileges, can access tailored tools and settings
As a manager, you can perform the following activities in the Wallboard application:
A manager can view and access data in all the menu options available in the Competitive Wallboard web portal.
Figure 27: Manager Login Screen Showing all the Menu Options
As a manager, you can perform the following tasks,
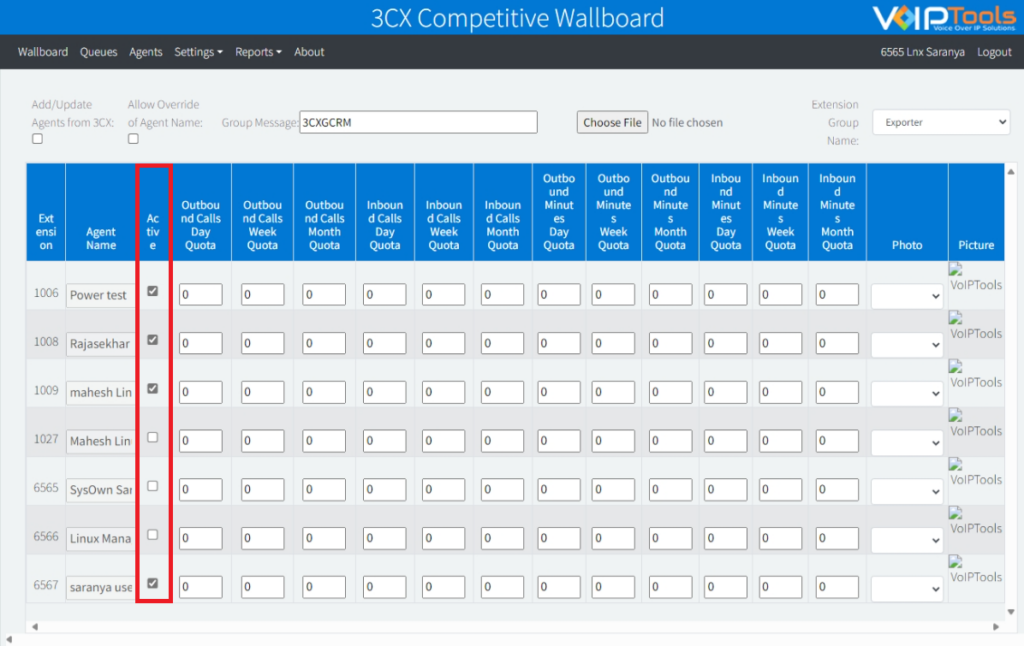
Activate/ Inactivate an agent.
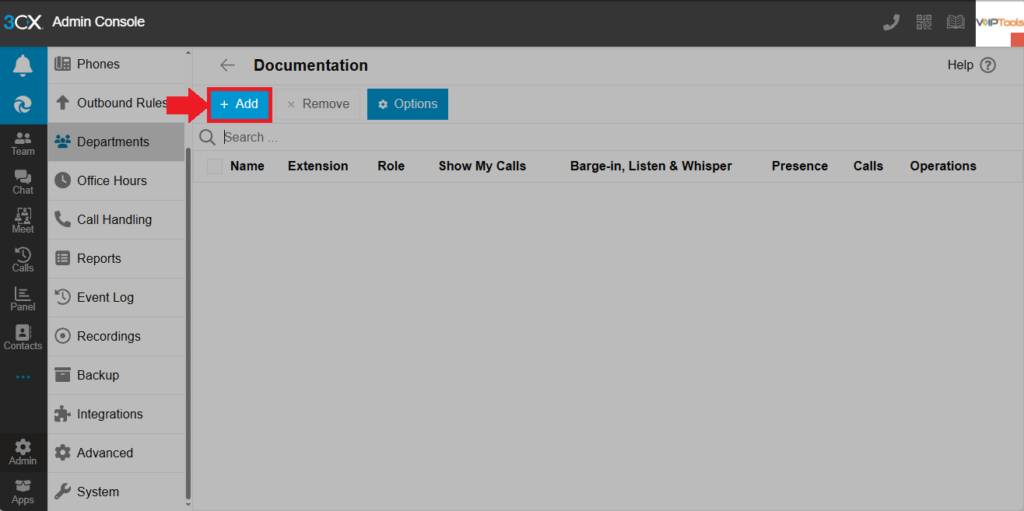
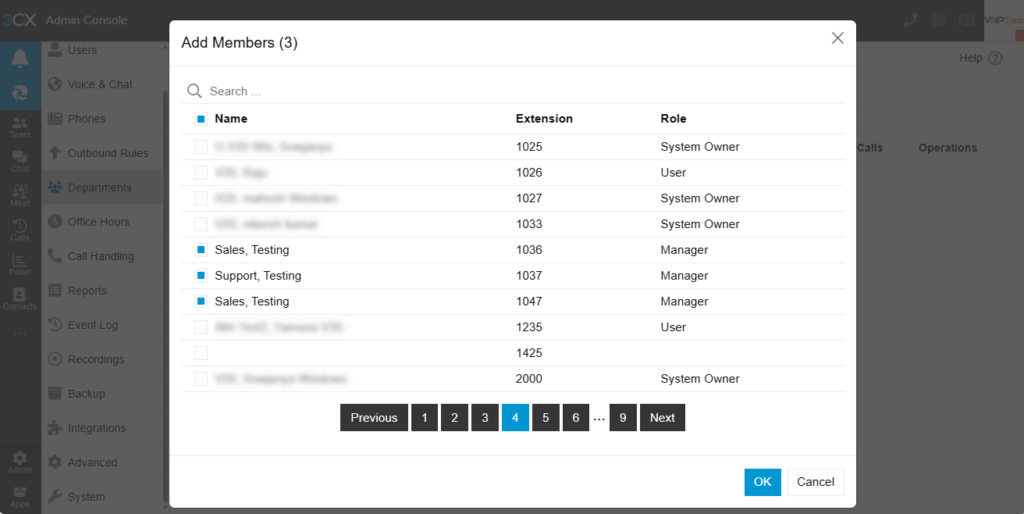
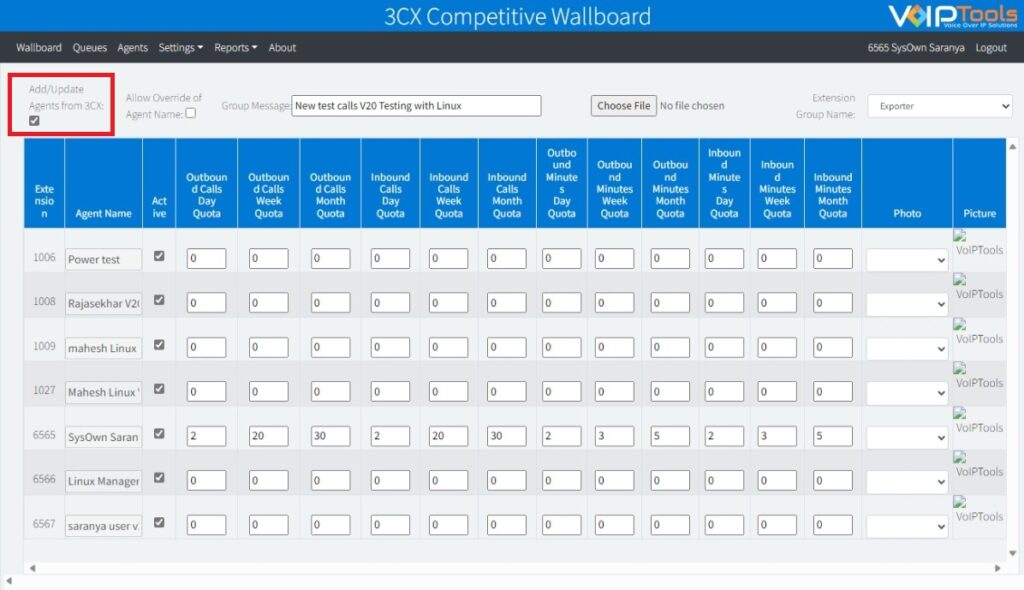
Add a new agent.
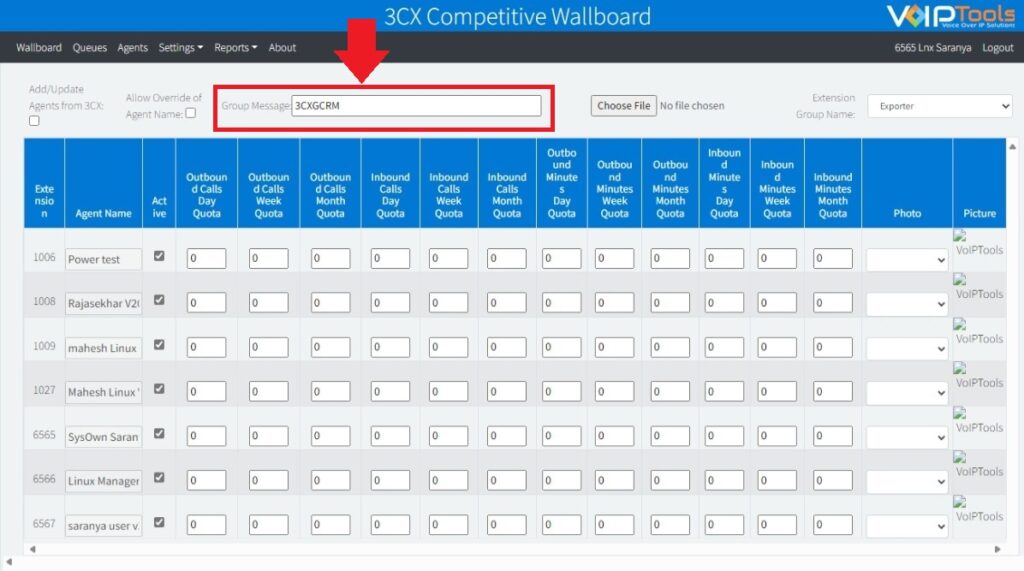
Send a group message to your agents.
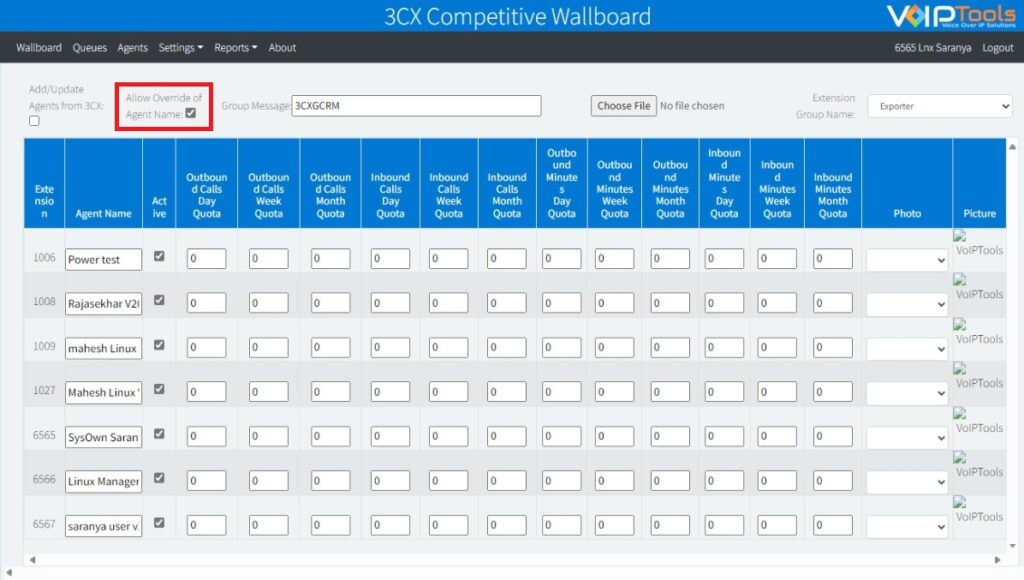
Change the name of the existing agents.
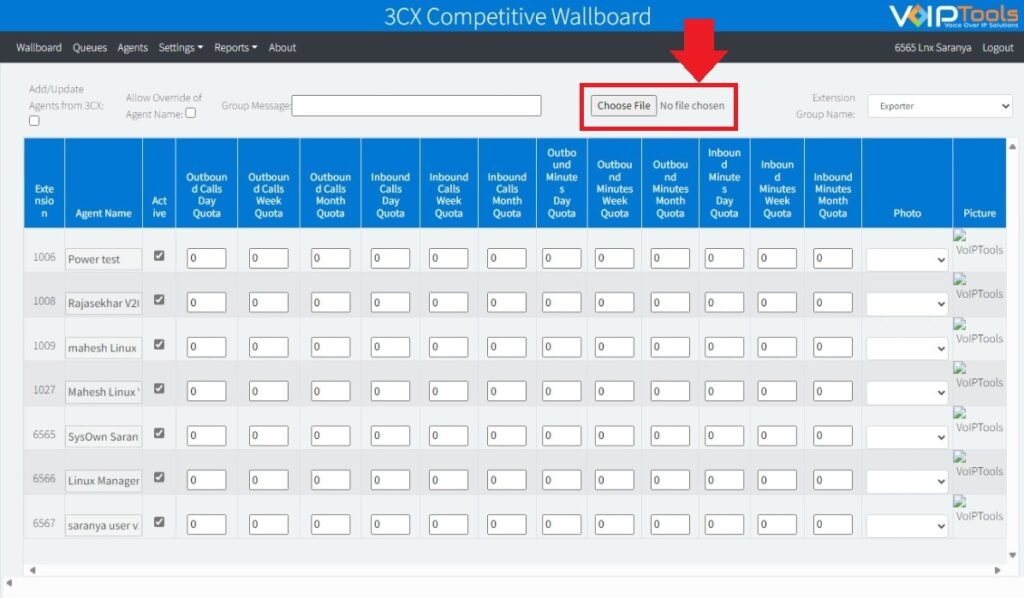
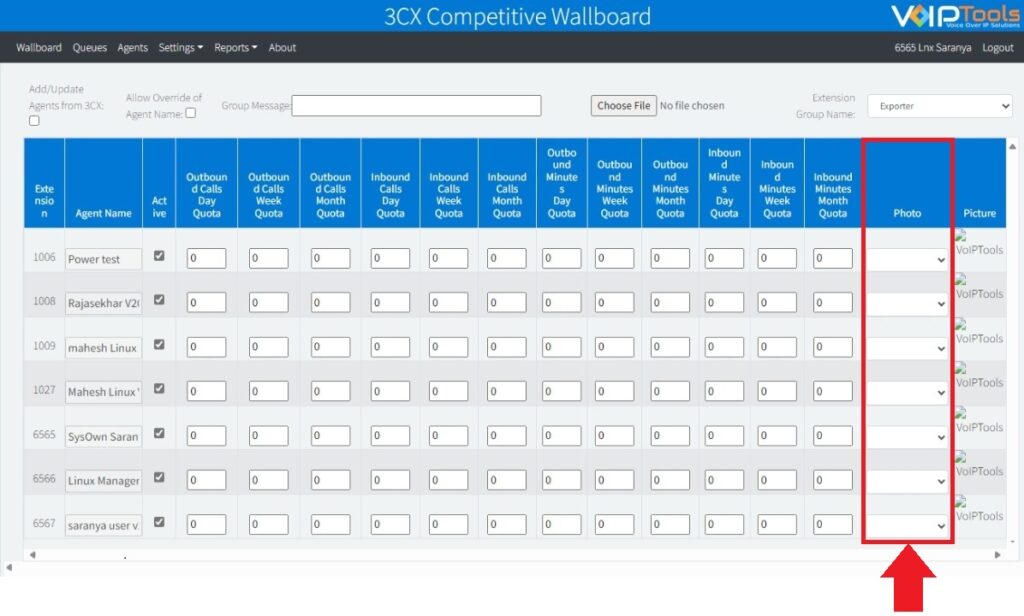
Upload new pictures or edit pictures of your agents.
View an agent’s idle time during the shift hours of the day and since the latest call.
View the current status of an agent and the time since the current status has been changed. View and export the complete status of your agents.
View agent’s custom statuses.
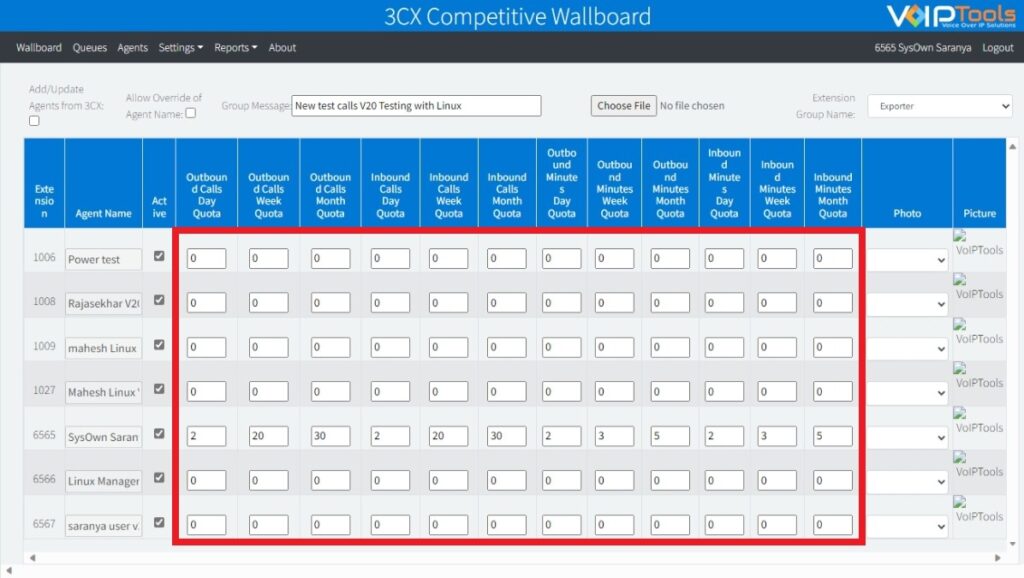
Set inbound and outbound day, week and month call quotas for any agent.
Configure font size for the ‘Wallboard’ screen.
Specify the 3CX Extension Group to monitor.
Edit extension group.
Set ‘Minimum Call Duration’ (in seconds) for an extension group so that a call can stand eligible for call count only after it reaches the set time.
Set ‘Work hours type’ for an extension so that the calls made in the set working hours will stand eligible for call count.
Set the ‘Sort Order’ setting for ‘Inbound’ or ‘Outbound’ calls in the ‘Wallboard’ screen to display the agents in descending order based on their inbound or outbound call count.
Reorganize the order of columns in the wallboard screen except that the ‘Picture’ column is always the first one.
Hide one or more columns in the wallboard screen except ‘Picture’ column.
View and export call log reports in various formats.
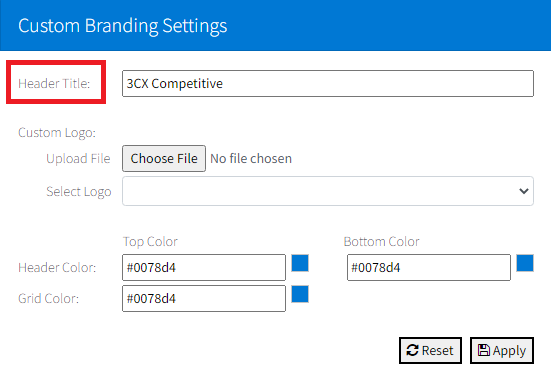
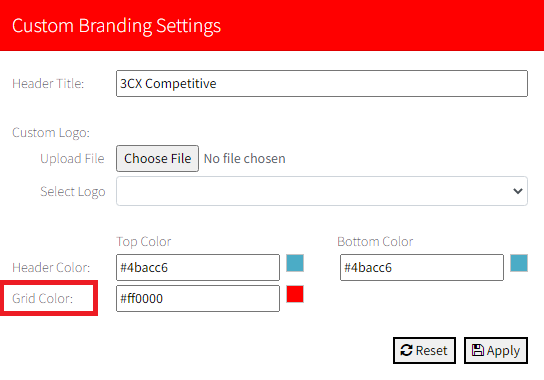
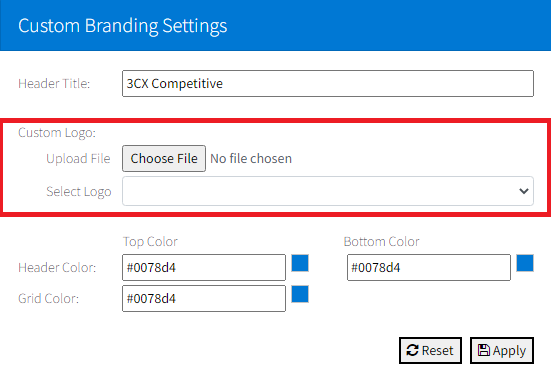
Customize the color, logo, and other elements to establish your brand identity.
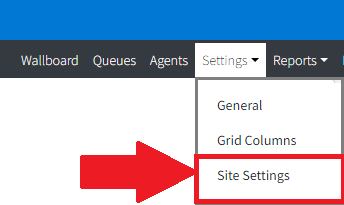
The Settings menu is where you shape how the Competitive Wallboard looks and works. It brings together the main setup areas in one place, so you can quickly adjust general behavior, column layout, agent details, user roles, and branding without hunting through the app.
This menu includes:
Figure 66: Settings Menu Overview
General for core wallboard options.
Grid Columns for choosing which data appears and how it is ordered.
Agent for agent-related settings.
Roles for access and permission control.
Custom Branding for applying your own visual identity.
It is designed to give managers and administrators a single, easy starting point for configuring the wallboard to match their team’s needs.
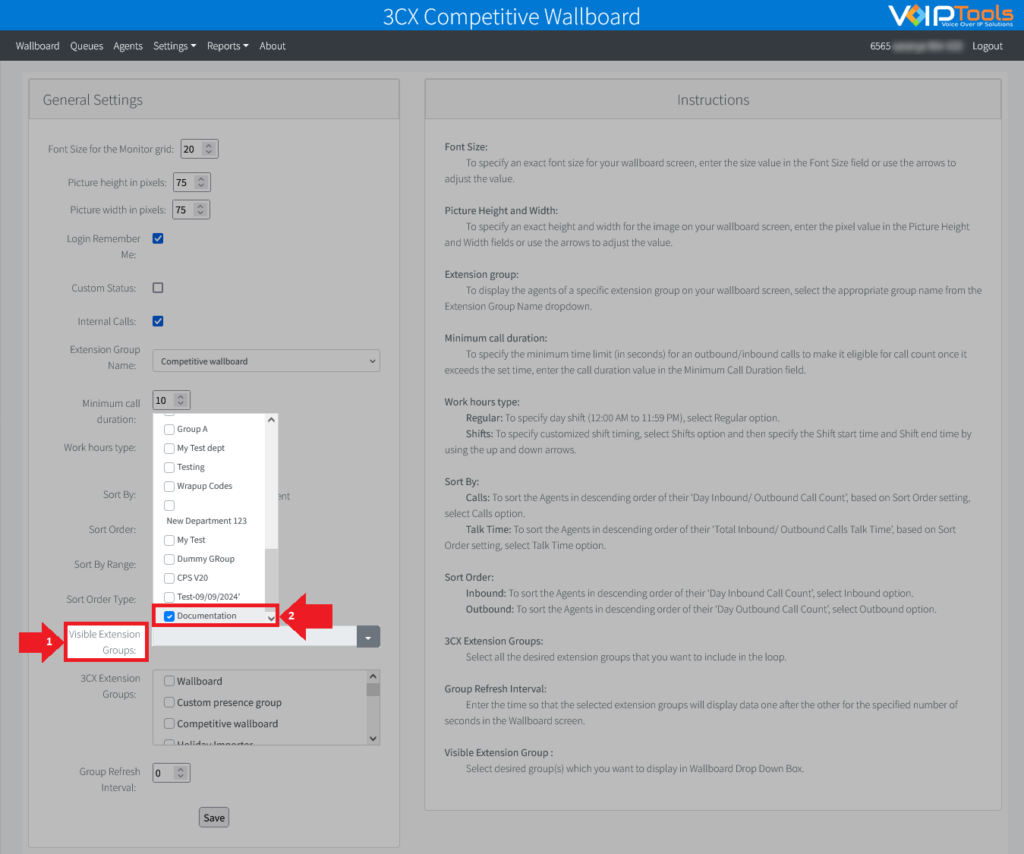
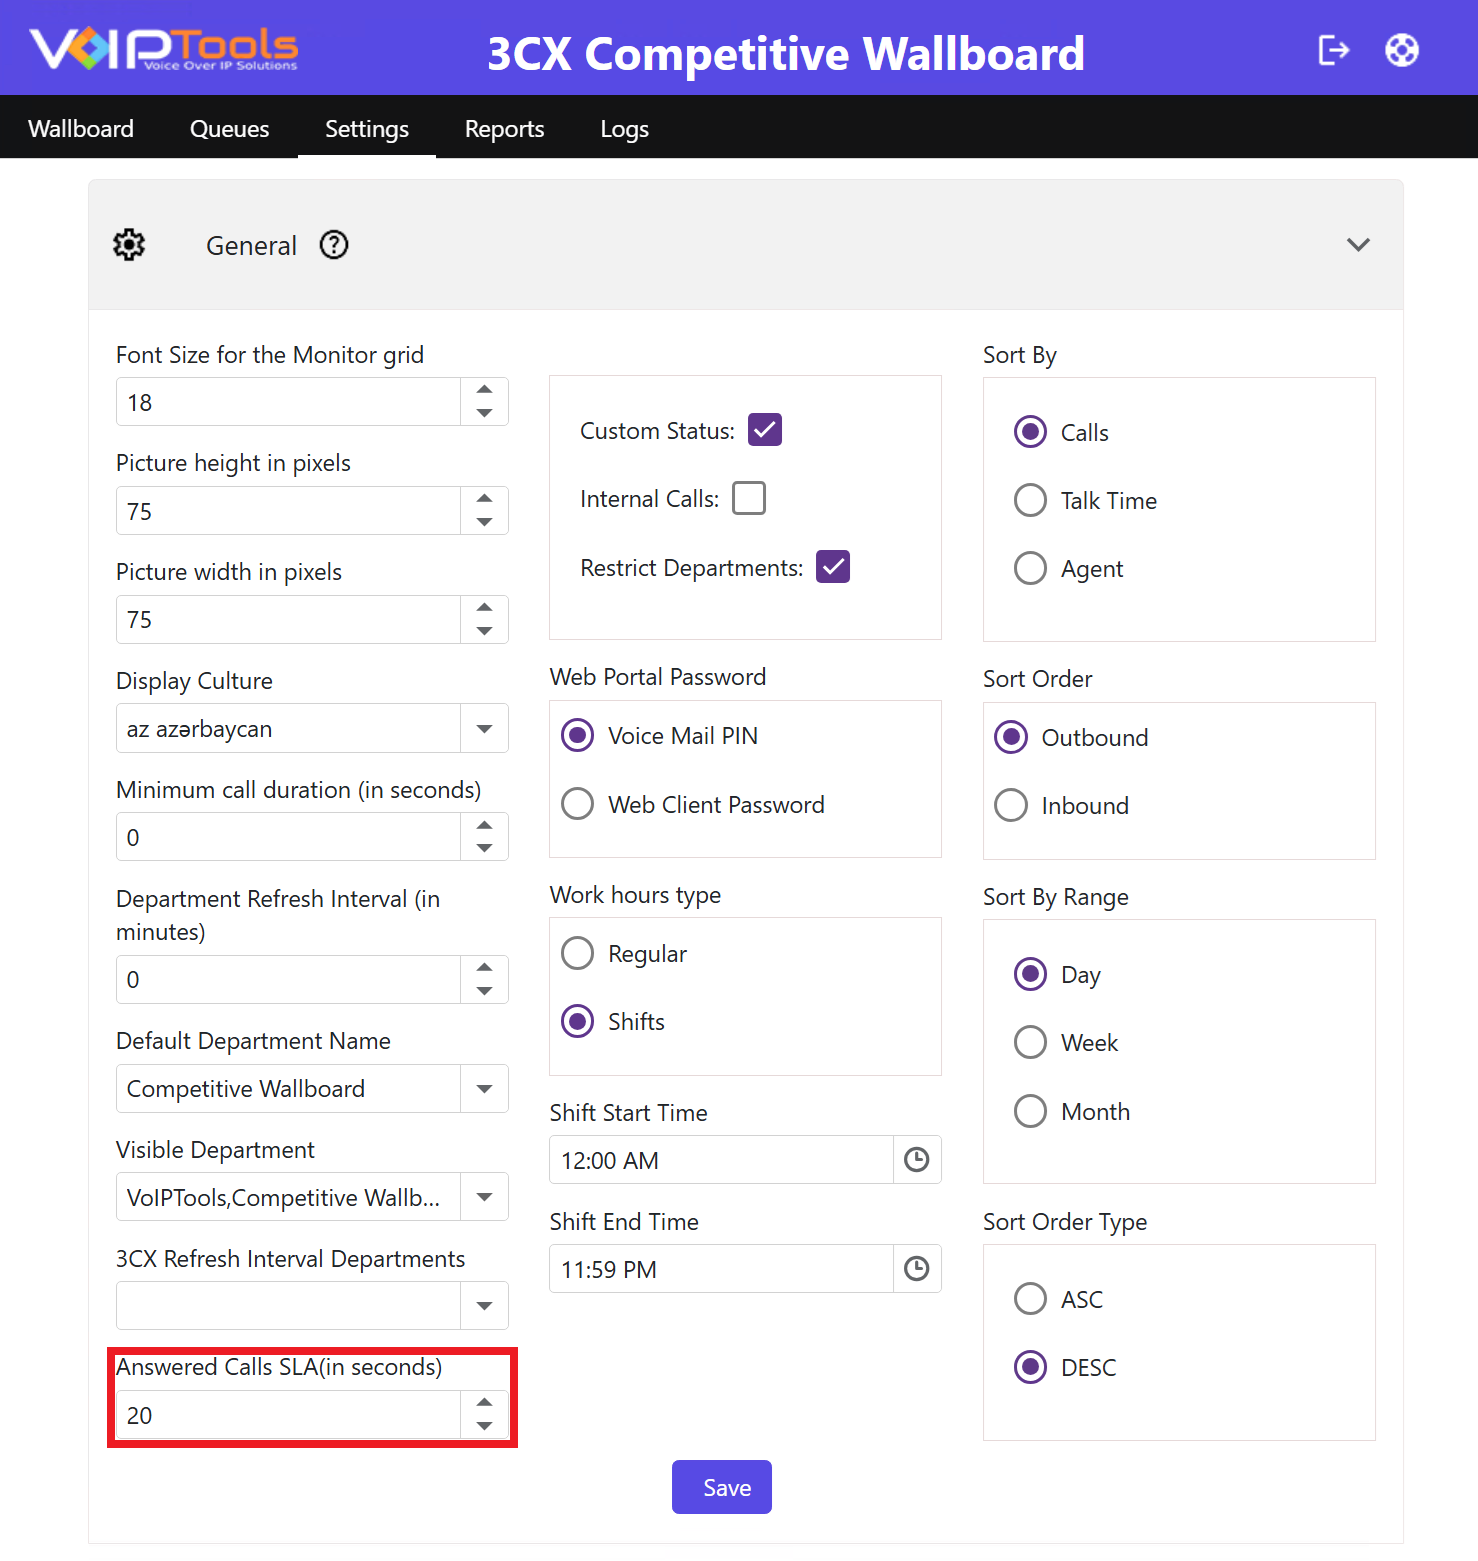
In the General panel, you can adjust the Wallboard display and call-handling rules from one place. The current UI shows these controls in three groups: display settings on the left, access and login-related options in the middle, and sorting options on the right. Use the General section to set the main Wallboard options shown in the latest screen: font size, agent photo size, display culture, minimum call duration, refresh timing, default and visible departments, SLA timing, custom status, internal calls, department restriction, working hours, and sort order. The panel also includes the Save button at the bottom.
Increase or decrease Font Size for the Monitor grid so the Wallboard text is easier to read from a distance. Enter the value directly or use the arrows beside the field, then click Save.
Set the department used by default in Default Department Name. Use Visible Department to choose which departments appear in the Wallboard, and use 3CX Refresh Interval Departments to control which departments cycle through refresh. Controls which departments agents can see on the board. You can select multiple. If Restrict Department is checked, only these departments will be visible.
Use the three checkboxes in the center column to configure key visibility flags: Custom Status, Internal Calls, and Restrict Departments.
Figure 75: Custom Status, Internal Calls, and Restrict Departments Checkboxes
Checkbox
Default
What it controls
Custom Status
☑ Checked
Check this box to allow agents to define custom availability statuses. Disable this feature only if your organization requires strict adherence to standard system statuses.
Internal Calls
☐ Unchecked
Check this if you want extension-to-extension calls to appear in wallboard stats. Most teams leave this off so the board only reflects customer-facing activity.
Restrict Departments
☑ Checked
Check this to restrict agent visibility to selected Visible Departments; disable it to grant access to all departments.
This setting determines whether the system uses the Voicemail PIN or Web Client Password to authenticate your access to the web portal. Choose the option that aligns with your organization’s credential management policy.
Figure 75: Custom Status, Internal Calls, and Restrict Departments Checkboxes
Option
When to use it
Voice Mail PIN
Uses each agent’s voicemail PIN as the login password. Good choice if your team is already familiar with this credential.
Web Client Password
Uses the 3CX Web Client password instead. Select this if your organization manages web client credentials separately.
Figure 78: Work Hours Type – Regular and Shift Timings
Choose your schedule type. Select Regular for standard fixed hours, or Shifts for rotating or non-standard hours. If your contact center runs multiple shifts, select Shifts.
If you selected Shifts, set your Shift Start and End times. Click each time field and type or use the clock picker. The defaults are 12:00 AM to 11:59 PM, which covers the full day.
NOTE:
Regular shift is day shift and the timings are 12:00 AM to 11:59 PM
These four settings control how agents are ranked on the wallboard. Together they answer: “Rank by what, in which direction, over what time range, and ascending or descending?” Figure 78: Sort By, Sort Order, Sort By Range, and Sort Order Type Panels
Sort By: What metric to rank agents on
Option
Description
Calls
Ranks agents by total number of calls handled. The most common choice for competitive leaderboards.
Talk Time
Ranks agents by total time spent on calls.
Agent
Sorts alphabetically by agent name — useful when you just need a consistent, neutral order.
Sort Order: Which call direction to measure
Option
Description
Outbound
Stats based on calls made by agents.
Inbound
Stats based on calls received by agents.
Sort By Range: Time window for stats
Option
Description
Day
Today’s activity only. Best for daily competitions.
Week
Current week’s activity.
Month
Current month’s activity.
Sort Order Type: High-to-low or low-to-high
Option
Description
DESC
Highest performers appear at the top. This is the typical leaderboard format.
ASC
Lowest performers appear at the top — useful for identifying who may need support or coaching.
After updating any setting, click Save at the bottom of the panel. That stores the changes for the Wallboard.
You can save after updating a single setting, or make several changes in the General tab and save them together at the end.
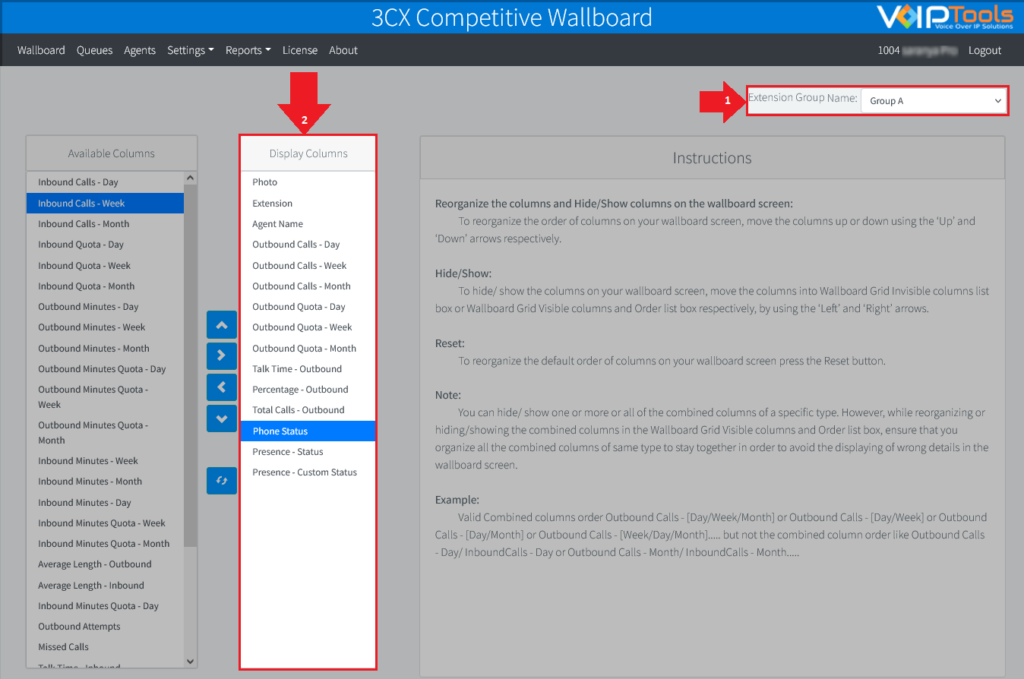
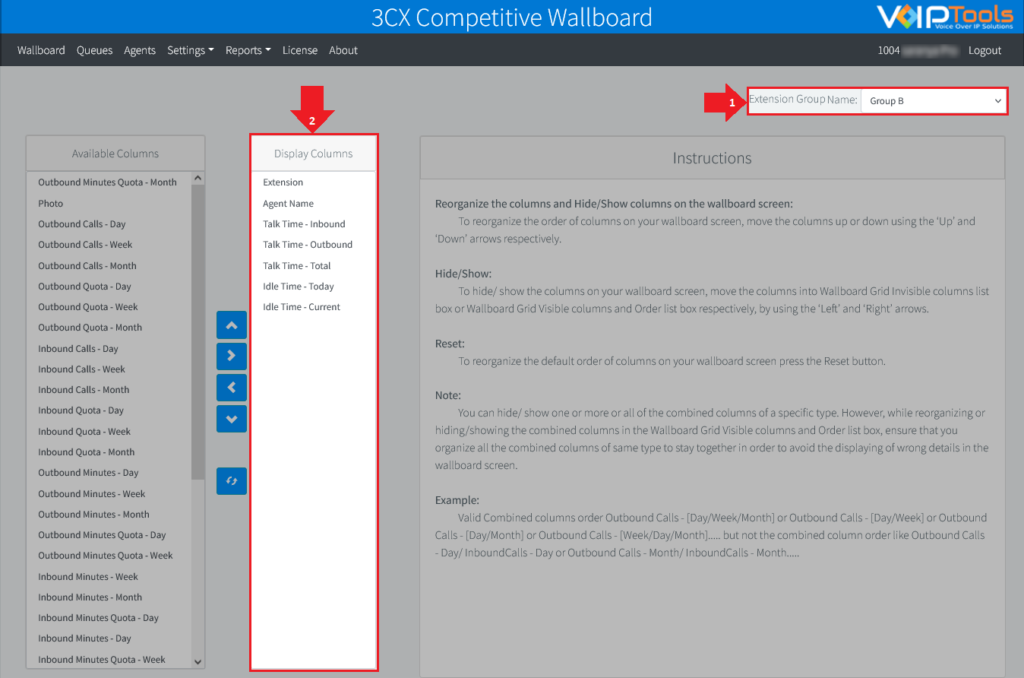
The Grid Column tab lets you customize the visibility and order of grid columns, enhancing the display of relevant information. This feature empowers Managers and Admins to tailor grid views for their groups, improving data accessibility, organization, and overall user experience by displaying only the most pertinent information.
On the Settings dialog box, under Wallboard Grid Visible columns and Order list box, select the column that you want to reorganize in the wallboard screen and click the Left or the Right button to move the column to the left or right-hand side respectively.
In the Competitive Wallboard application, Managers and Admins have control over grid columns via the Grid Columns settings. Here are three general cases that explain how grid column changes affect different user groups.
When a Manager updates the grid columns, those changes apply to all members of their group. For example, if a Manager adjusts the grid settings, every user in that Manager’s group will see the updated columns.
A Manager can only modify the grid columns for their own group. However, if a Manager is also a member of another group, they can change the grid columns for that group as well.
When an Admin modifies the grid columns, the changes apply to the selected groups that the Admin is a part of. However, if the Admin is not a member of a particular group, the Admin cannot modify that group’s grid columns.
To check if the agent is successfully activated, you can confirm by displaying the wallboard screen. The agent should display in the list of monitored agents.
To confirm that the agent has been successfully inactivated, you can view the Wallboard screen. The inactivated agent should no longer display on the list of agents.
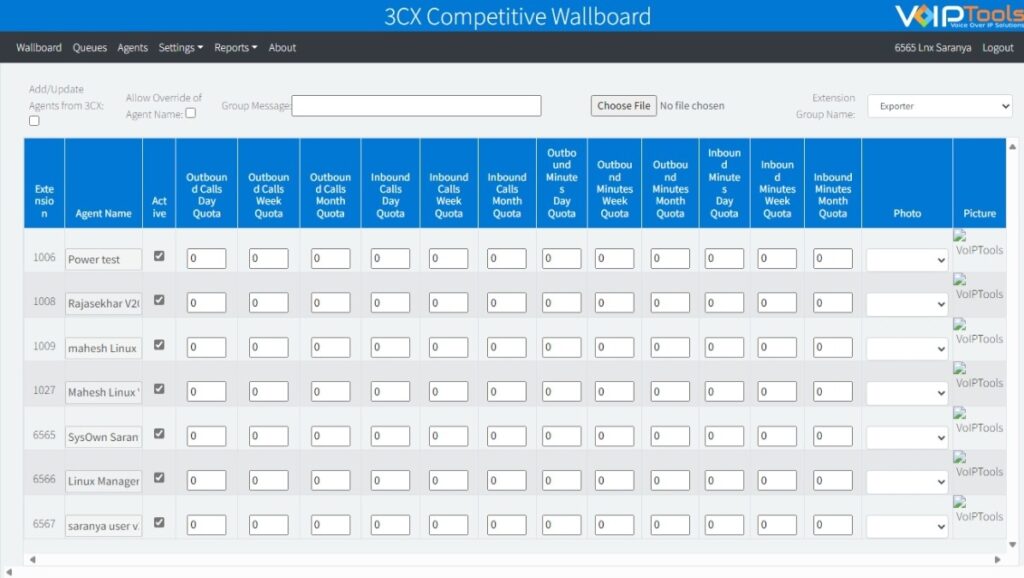
Select the Agents menu option and identify the record of the agent for whom you want to change the quota.
If you want to edit inbound call quota, click Inbound Day Quota or Inbound Week Quota or Inbound Month Quota depending on the type of inbound quota that you want to edit.
Similarly, if you want to edit outbound call quota, click Outbound Day Quota or Outbound Week Quota or Outbound Month Quota depending on the type of outbound quota that you want to edit.
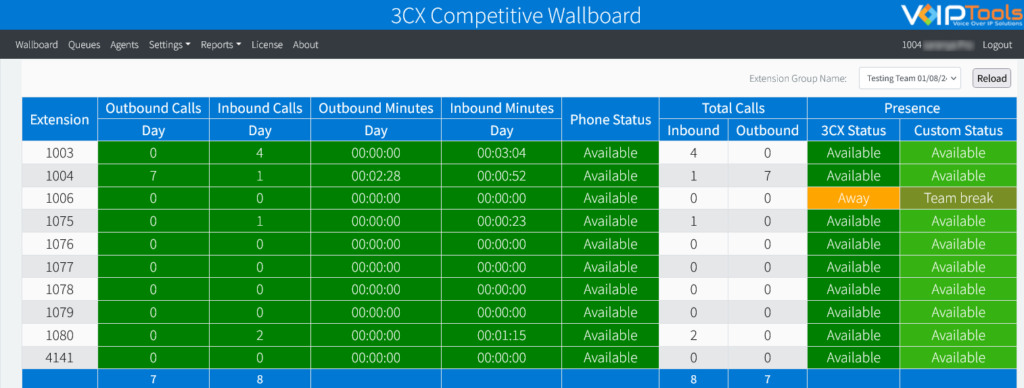
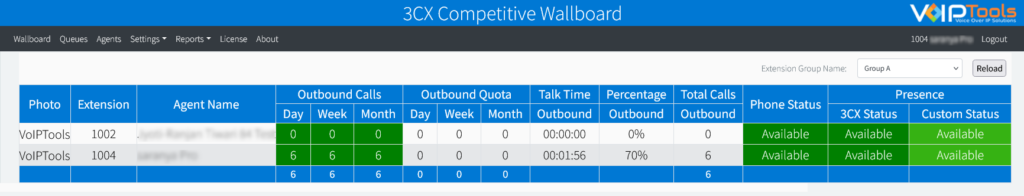
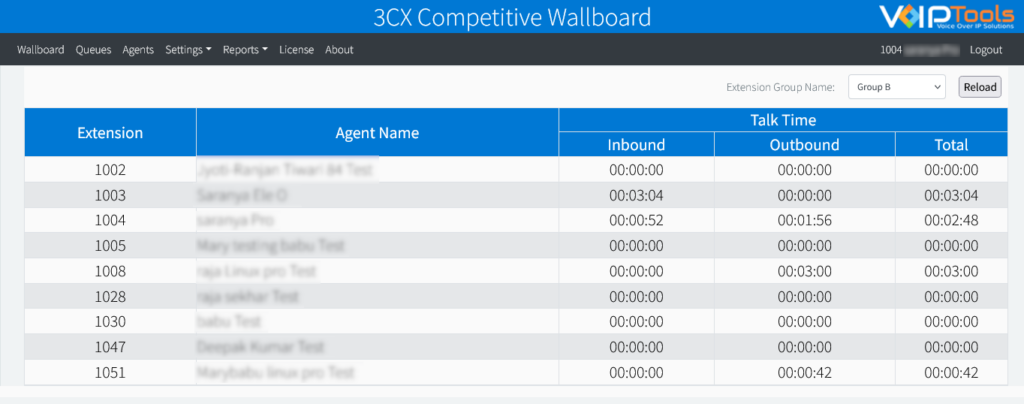
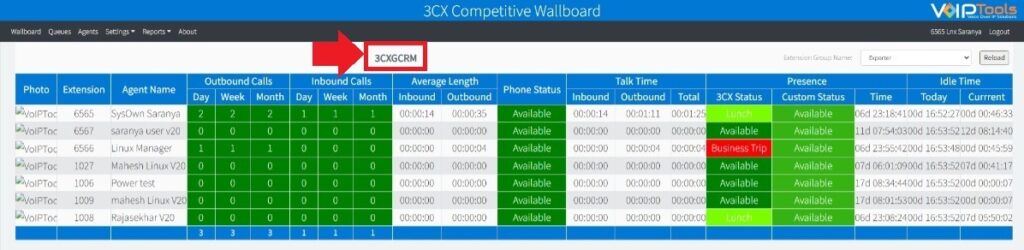
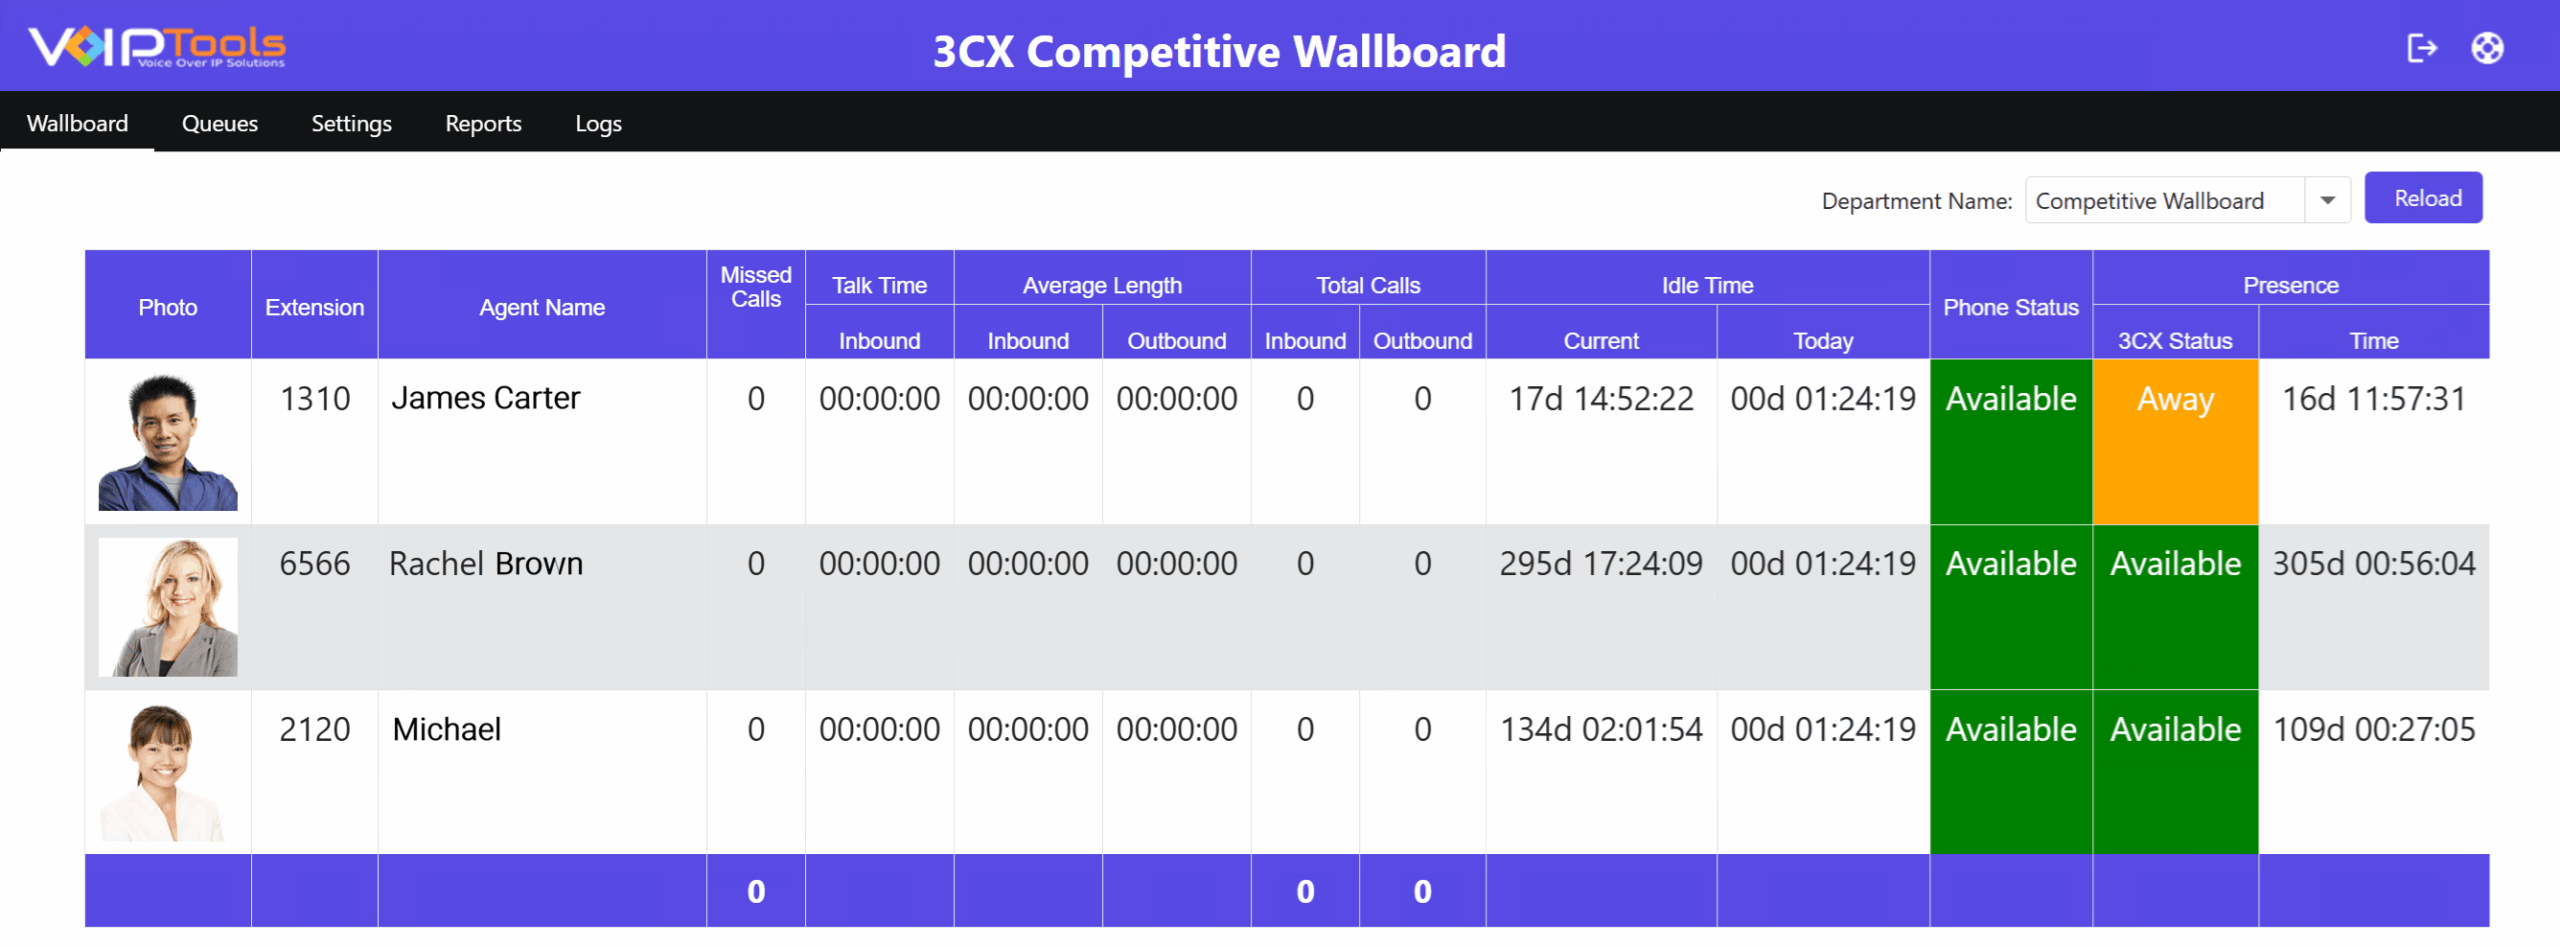
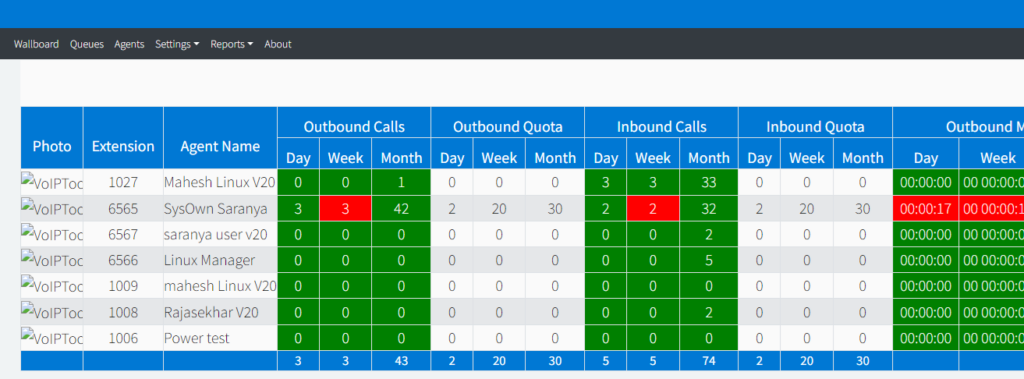
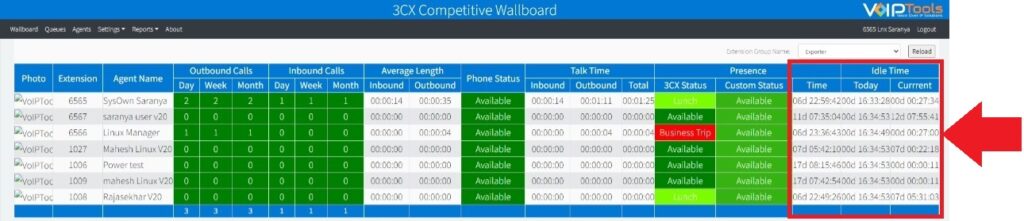
The Wallboard screen provides a real-time overview of all active agents within a department name, displaying key call statistics such as outbound and inbound calls, call quotas, and agent statuses. It allows managers and agents to monitor performance, track quota achievements, and view idle time, ensuring efficient call handling and resource management.
The Wallboard screen can be viewed by agents who are assigned either ‘Manager’ or ‘Agent’ roles.
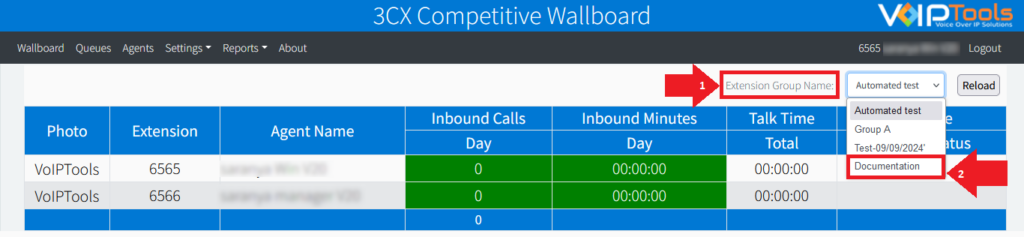
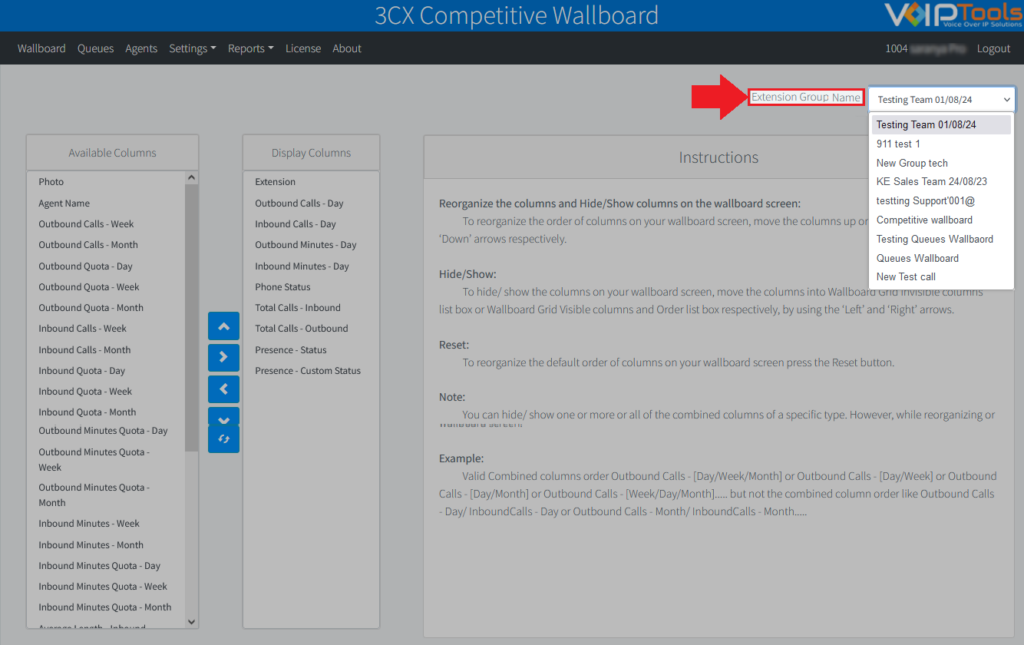
The Wallboard screen displays data as per the selected Department Name. In the Config Settings screen, if you have configured 3CX Extension Groups to display data according to the timer, then the Wallboard screen displays data of all the extension groups that are a part of the loop one after the other for a specified number of seconds.
In the Wallboard screen, once you select an extension group that is not a part of the loop, the loop will break and the Wallboard will display data related to the selected group only. If you want to restart the loop, then select an extension group that is a part of the loop.
If you have configured a Group Message for desired extension group in the Agents screen, then the Wallboard screen displays the group message when you select that group from the Extension Group Name dropdown list.
The Wallboard screen displays the list of all the agents associated to the group that you select from the Extension Group Name drop-down list.
Depending on the Sort Order setting (Inbound/ Outbound) that you have selected in the Settings screen, the Wallboard screen displays the agent’s information in the following way:
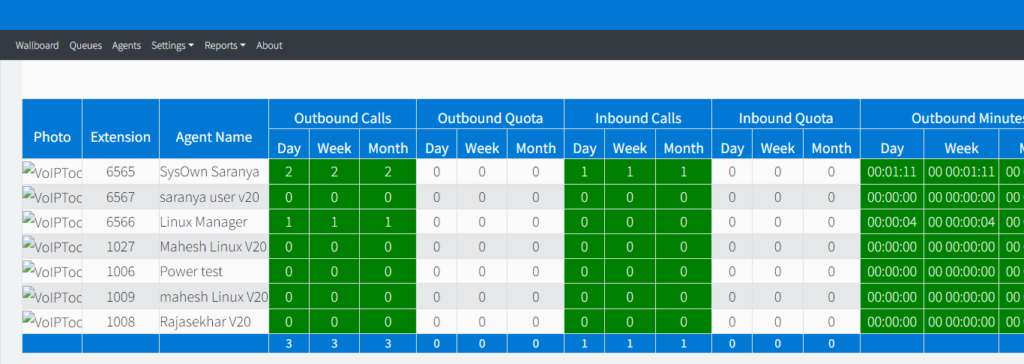
If the Sort Order setting is Outbound, then the agents will be displayed in descending order based on the outbound call count.
If the Sort Order setting is Outbound and if the daily outbound call count for any two agents is the same, then the agent with the highest Outbound Talk Time for the day will be displayed above the other agent.
If the Sort Order setting is Inbound and if the daily inbound call count for any two agents is the same, then the agent with the highest Inbound Talk Time for the day will be displayed above the other agent.
The footer of the Wallboard screen displays the sum of outbound calls of all the agents per day/ week/ month, sum of inbound calls of all the agents per day/ week/ month, and the average percentage of answered inbound/ outbound calls of all the agents per day.
The Wallboard screen displays Idle Time data only when you select Work hours type as Shifts in the Settings page. Idle Time is an active timer that runs to display the amount of idle time of an agent during shift hours.
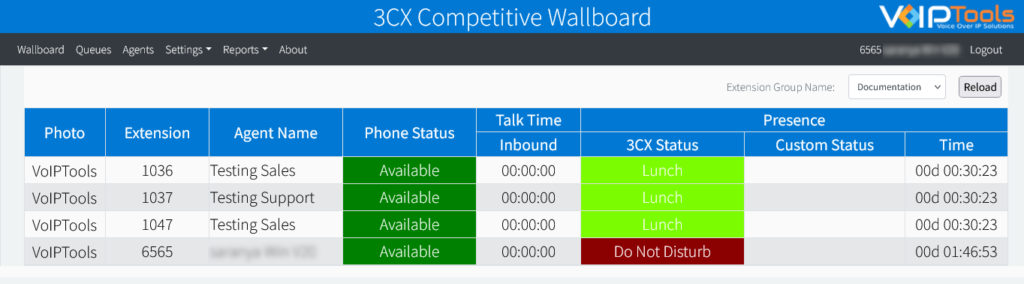
Presence displays the current Agent Status and the Time since the latest updated Agent Status in the ‘3CX Smart Phone’.
The agent’s profile picture as stored in the 3CX system or uploaded via the Settings page. Displayed as a thumbnail for quick visual identification of the agent in each row.
Extension ID
The unique numeric identifier assigned to the agent’s phone line within the 3CX PBX (e.g., 1310, 6566, 2120). Used to route calls directly to the agent. Must be unique across the entire system.
Agent Name ID
The full display name of the agent as registered in the 3CX directory. Used throughout the wallboard for identification in reports, queue assignments, and status tracking.
Call activity metrics
Missed Calls InboundCount
The total number of inbound calls that rang to this agent but were not answered during the current tracking period. A high value may indicate the agent is unavailable, in Do Not Disturb mode, or overwhelmed by concurrent calls.
Talk Time InboundDuration
The cumulative duration of all completed inbound calls handled by the agent during the current period. Displayed in HH:MM:SS format. A primary indicator of inbound call workload.
Average Length InboundDuration
The mean duration of all inbound calls received by the agent. Calculated by dividing total inbound talk time by the number of completed inbound calls. Useful for benchmarking call handling consistency.
Average Length OutboundDuration
The mean duration of all outbound calls placed by the agent. Calculated by dividing total outbound talk time by the number of completed outbound calls. Helps identify patterns in outbound call strategy.
Total Calls InboundCount
The total number of inbound calls successfully answered by the agent during the current tracking period. Excludes missed or rejected calls. A primary KPI for inbound call volume and availability.
Total Calls OutboundCount
The total number of outbound calls placed by the agent during the current tracking period. Includes all completed outbound calls regardless of duration. Tracks proactive outreach activity.
Idle time
Idle Time — Current Timer
The continuous duration the agent has been idle since their last call ended or status changed. Displayed as a live running timer in DD HH:MM:SS format. Resets to zero each time the agent begins a new call or changes status.
Idle Time — Today Timer
The cumulative total time the agent has spent idle since midnight of the current business day. Unlike Current Idle Time, this counter does not reset between calls — it accumulates throughout the full shift and resets at midnight.
Status & presence
Phone Status Status
The real-time telephony state of the agent’s extension as reported by the 3CX PBX. Indicates whether the line is currently free or active. Typical values: Available and On a Call. Updated live by the 3CX engine.
3CX Status PresencePresence
The agent’s self-reported presence state within the 3CX client. Set manually by the agent or automatically by schedule rules. Common values: Available, Away, Do Not Disturb, Out of Office, Lunch. Independent of Phone Status — an agent can be telephony-available but marked Away.
Time Presence durationPresence
The elapsed time the agent has been in their current 3CX presence state. Displayed in DD HH:MM:SS format. Resets each time the presence state changes. Useful for identifying agents who have been in a non-available state for an extended period.
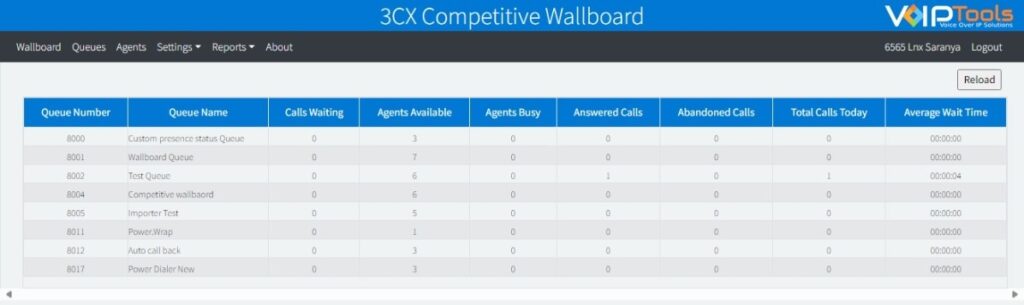
The Queues screen provides an overview of call queue activities for the current day, focusing specifically on inbound external calls. It displays key metrics such as the number of calls waiting, agents available, agents busy, answered calls, abandoned calls, total calls, and average wait time. This information helps in effectively managing call queues and ensuring efficient call handling.
The unique numeric identifier assigned to the queue within the 3CX PBX system (e.g., 8038, 8043). Callers dial this number — or are routed to it — to enter the queue. Must be unique across the system and is used in the Select Queues for Monitoring filter.
Queue Name ID
The descriptive label given to the queue in the 3CX configuration (e.g., “Competitive Wallboard”, “VoIPTools Technical Support”). Provides human-readable context for identifying the purpose or team associated with each queue number.
Real-time queue activity
Calls Waiting Live
The number of callers currently on hold in the queue waiting to be connected to an available agent. Updates in real time. A persistently high value indicates insufficient agent availability relative to incoming call volume.
Agents Available Live
The number of agents currently logged into the queue with a status that allows them to receive calls (i.e., not busy, not in Do Not Disturb, and not paused). Reflects the real-time capacity of the queue to handle waiting or incoming calls.
Agents Busy Live
The number of agents assigned to this queue who are currently engaged in an active call. Together with Agents Available, this gives a complete picture of current agent utilization within the queue at any given moment.
Call volume counters
Answered Calls Count
The total number of calls routed to this queue that were successfully connected to and answered by an agent during the current tracking period. Excludes abandoned calls. A key measure of queue throughput and agent responsiveness.
Abandoned Calls Count
The total number of callers who entered the queue but disconnected before being connected to an agent during the current tracking period. High abandonment rates typically indicate long wait times or insufficient staffing. A critical metric for assessing caller experience.
Total Calls Today Count
The cumulative total of all calls that entered this queue since midnight of the current business day, including answered, abandoned, and any transferred calls. Provides an overall picture of daily inbound demand for the queue. Resets at midnight.
Performance metrics
Average Wait Time Inbound queueDuration
The mean time callers spend waiting in the queue before being connected to an agent, displayed in HH:MM:SS format. Calculated across all answered calls in the current tracking period. A primary indicator of queue efficiency and caller experience quality.
Answered Calls SLA Service Level AgreementCount
The number of answered calls that met the configured SLA threshold — meaning they were answered within the target response time (e.g., within 30 seconds). Used alongside SLA% to evaluate whether the queue is consistently meeting its service standard.
SLA% Service Level AgreementPercentage
The percentage of total calls answered within the pre-configured SLA time threshold. Calculated as: (Answered Calls SLA ÷ Total Calls) × 100. A common benchmark is 80% of calls answered within 30 seconds. The primary KPI for measuring overall queue service quality and team performance.
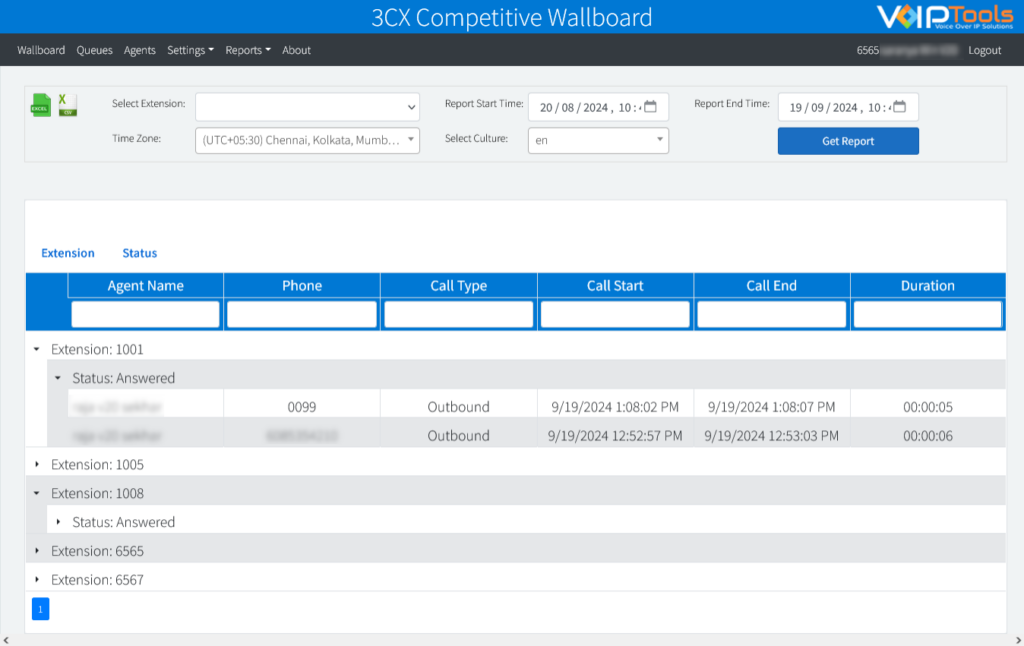
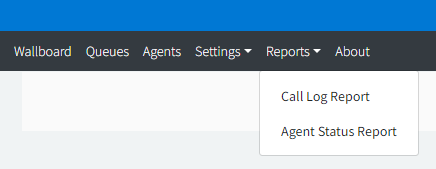
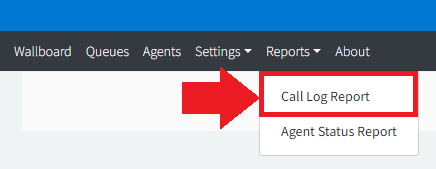
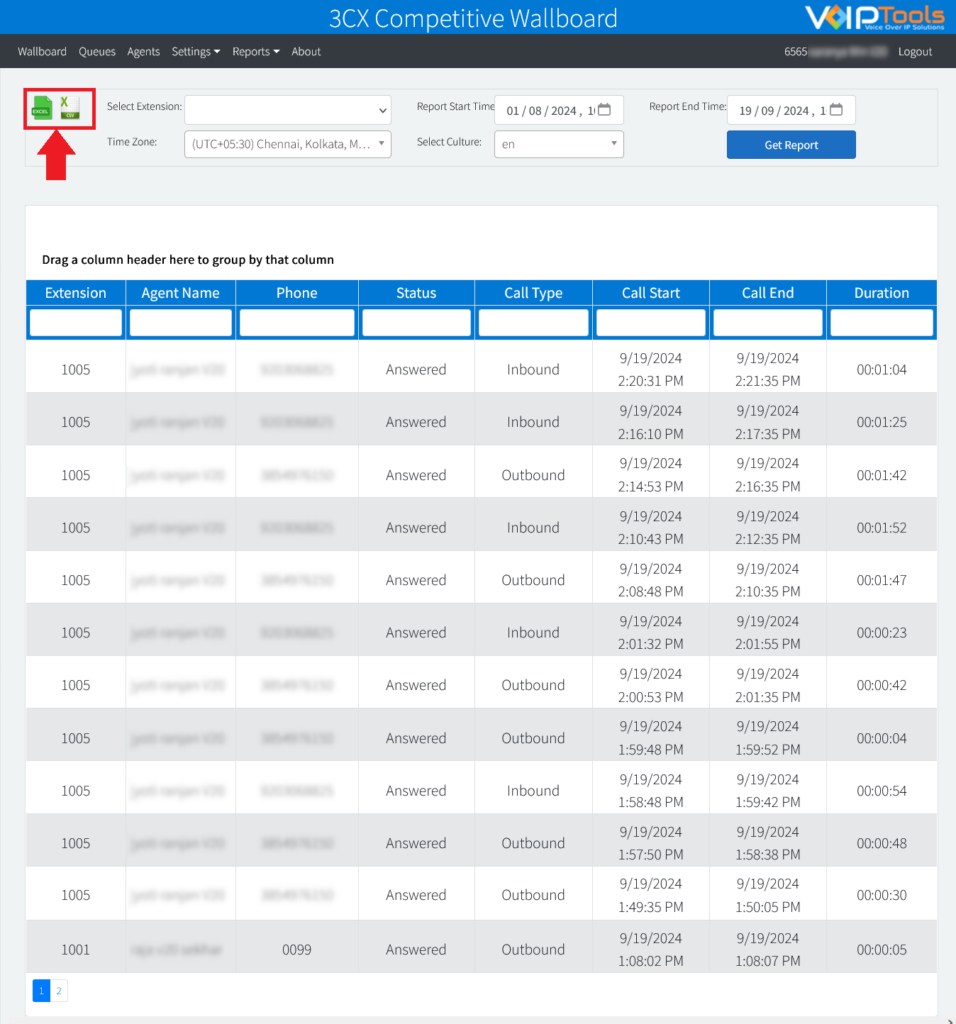
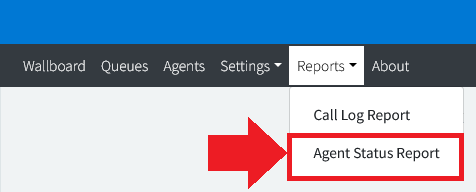
The Reports screen provides comprehensive tools for exporting data and viewing detailed reports on call activities and agent statuses. It includes options like the Call Log Report and Agent Status Report, allowing managers to filter, view, and export data in various formats such as PDF, XLS, and CSV. This functionality supports efficient tracking and analysis of call metrics and agent performance over time.
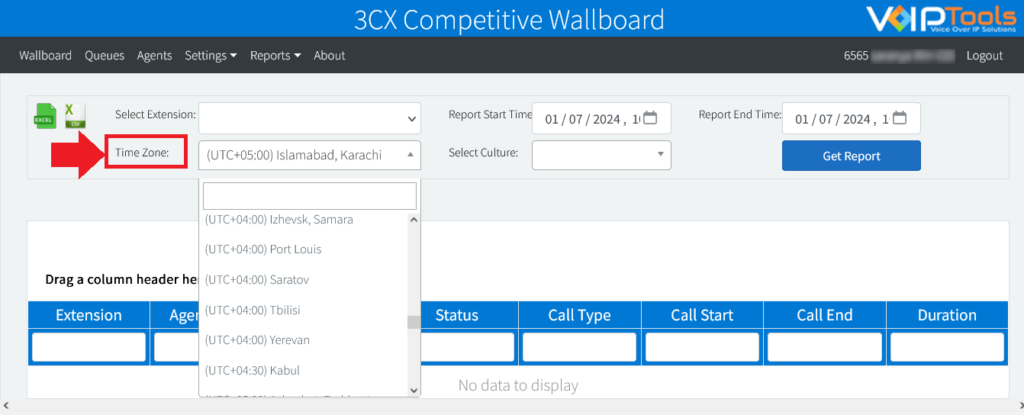
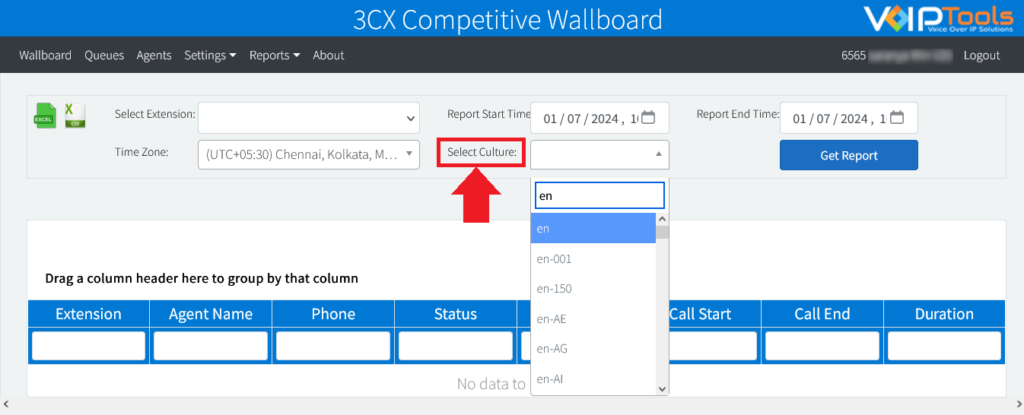
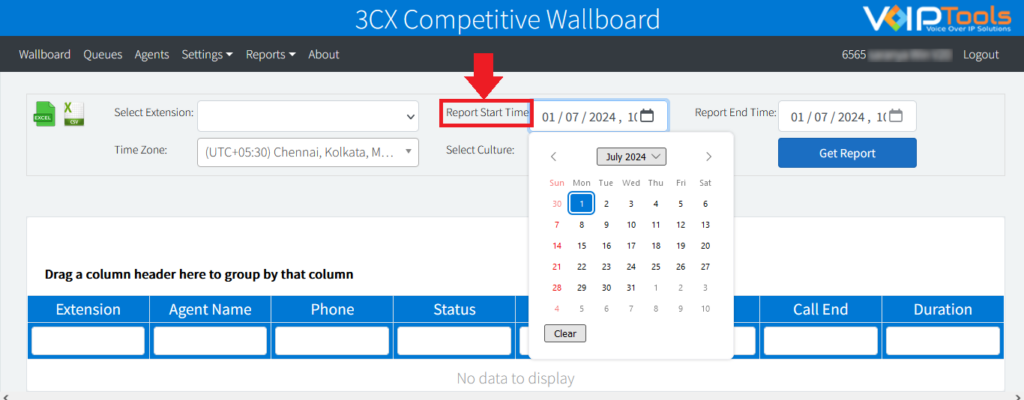
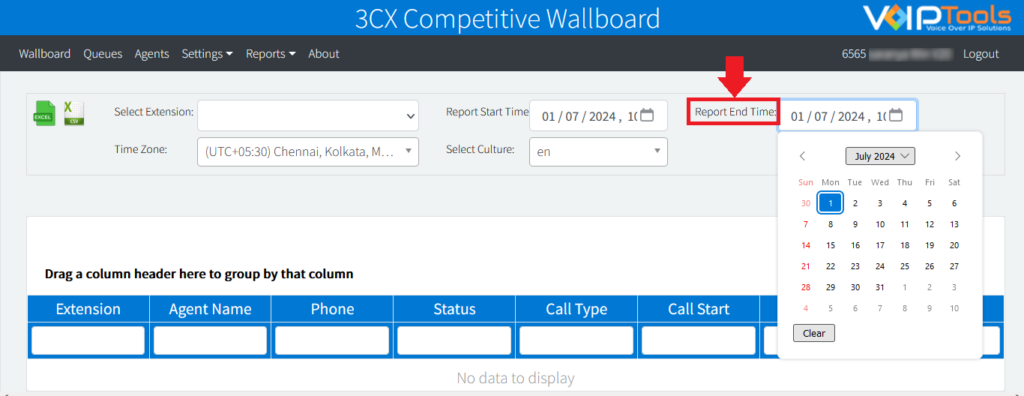
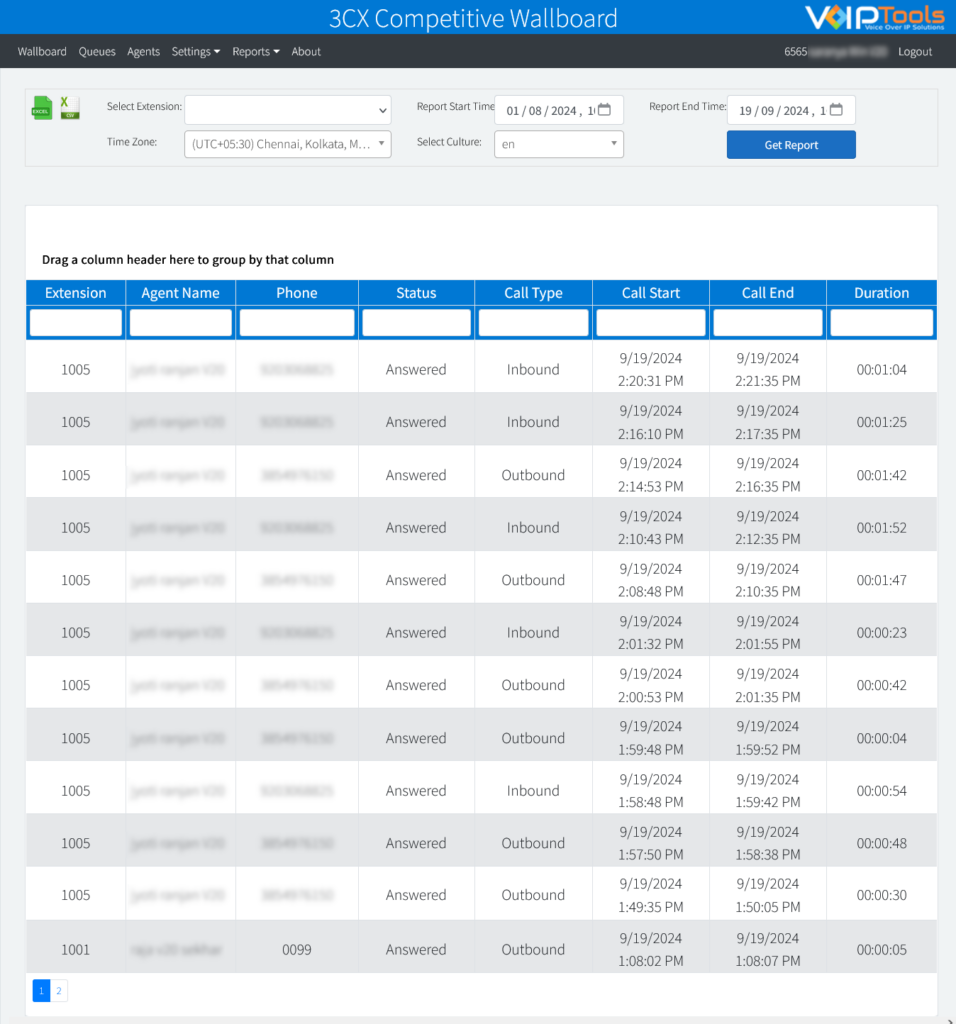
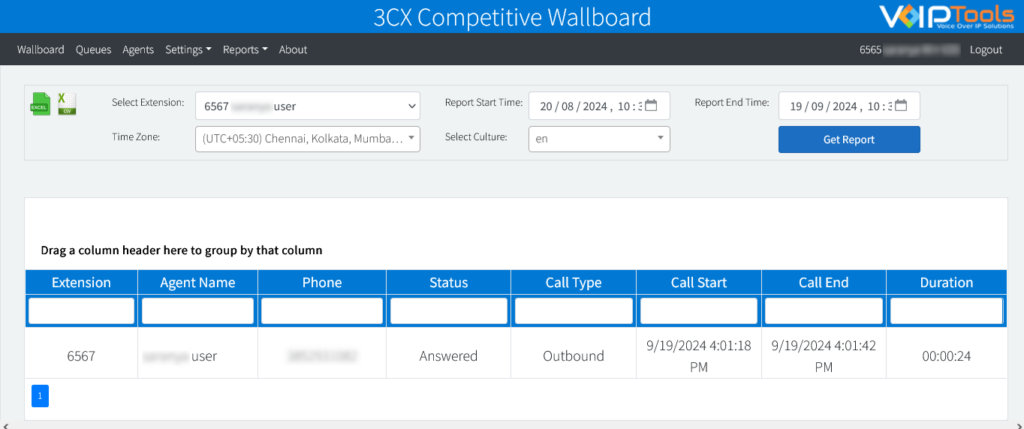
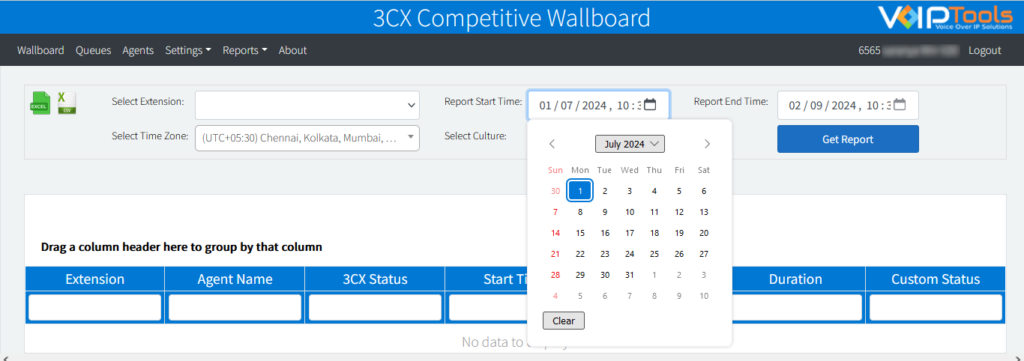
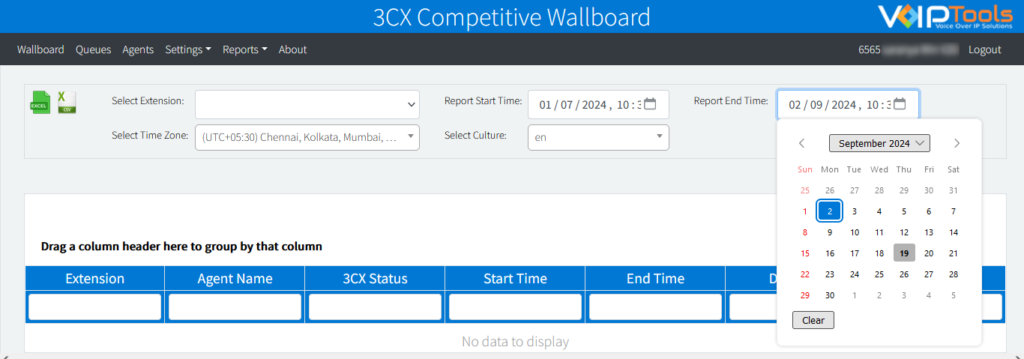
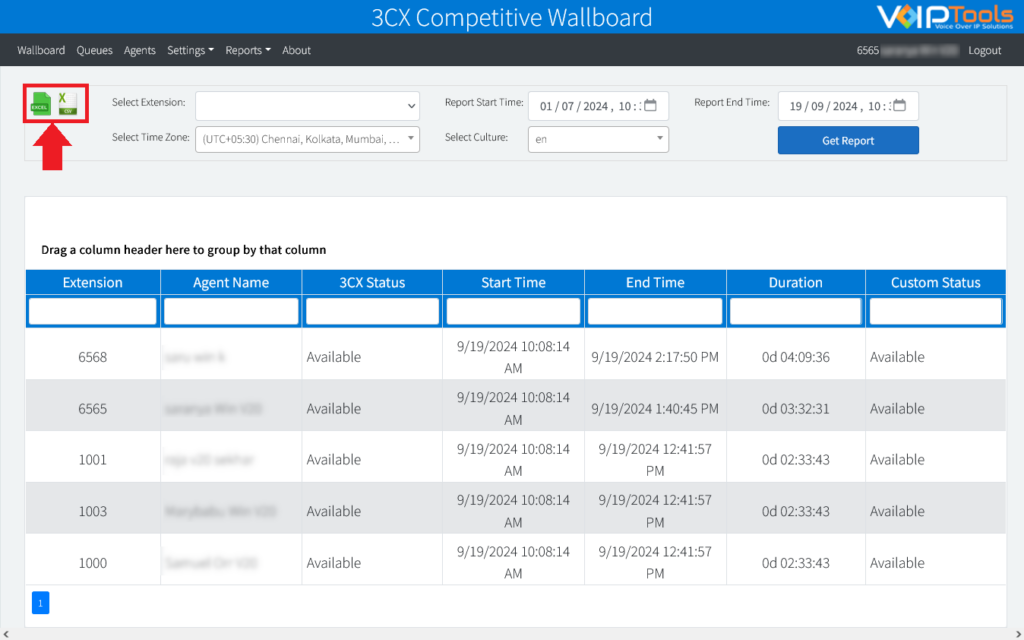
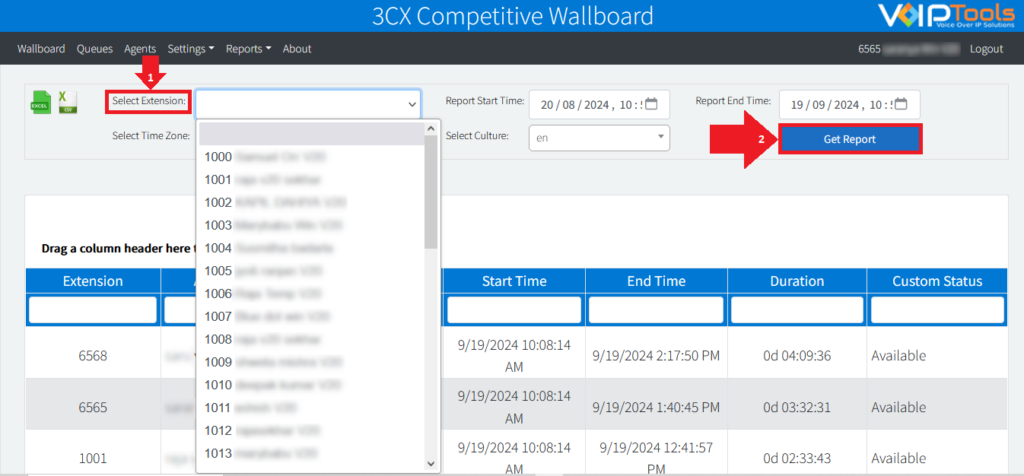
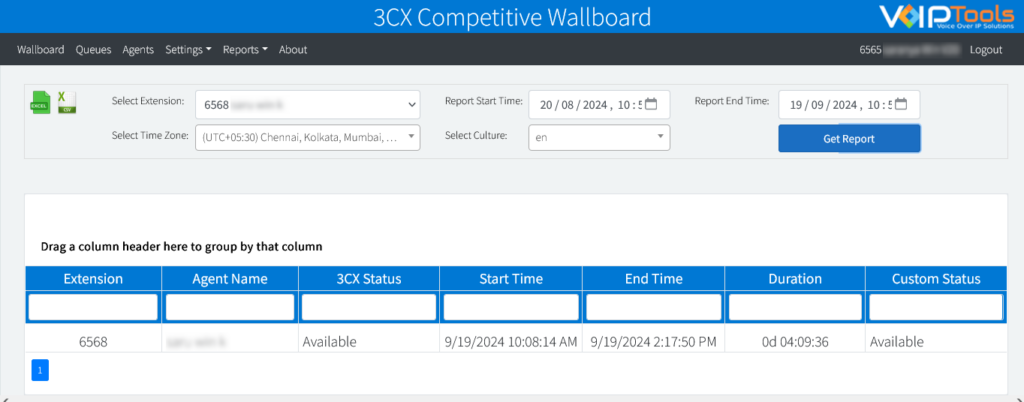
The Call Log Report screen displays list of all the calls placed by the agents. You can also view the list of call records for a specific day by selecting the desired date in Call Start and Call End date pickers. The log contains details including ‘Agent Name’, ‘Extension’, ‘Call Status’, ‘Call Duration’ etc.
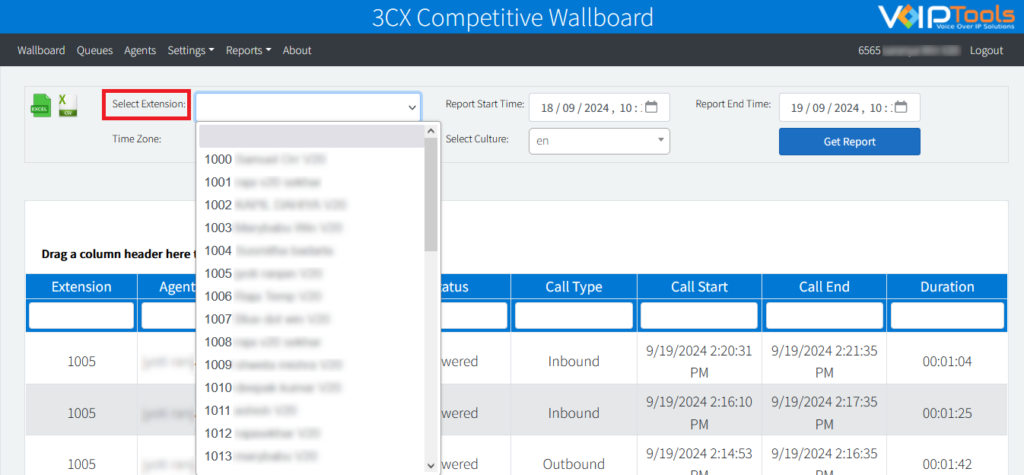
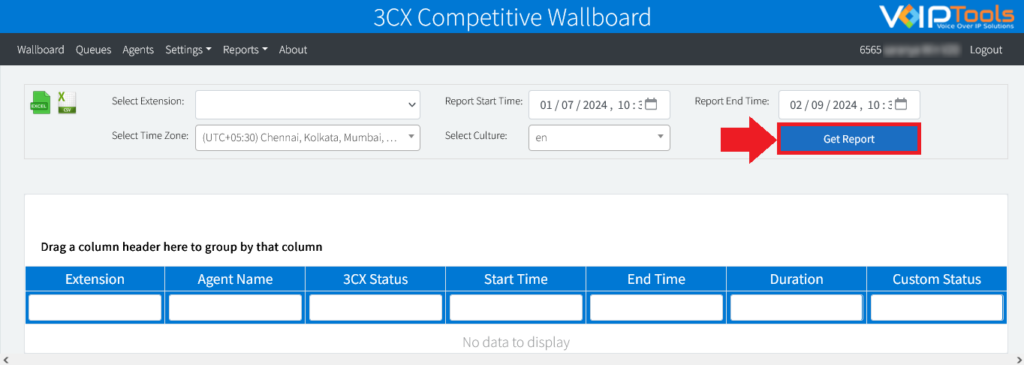
The Call Log Report screen lets you generate call log report for the desired range and export data in various formats. You can also export the reports for a particular extension.
The Call Log Report screen displays list of all the calls placed by the agents. You can also view the list of call records for a specific day by selecting the desired date in Call Start and Call End date pickers. The log contains details including ‘Agent Name’, ‘Extension’, ‘Call Status’, ‘Call Duration’ etc.
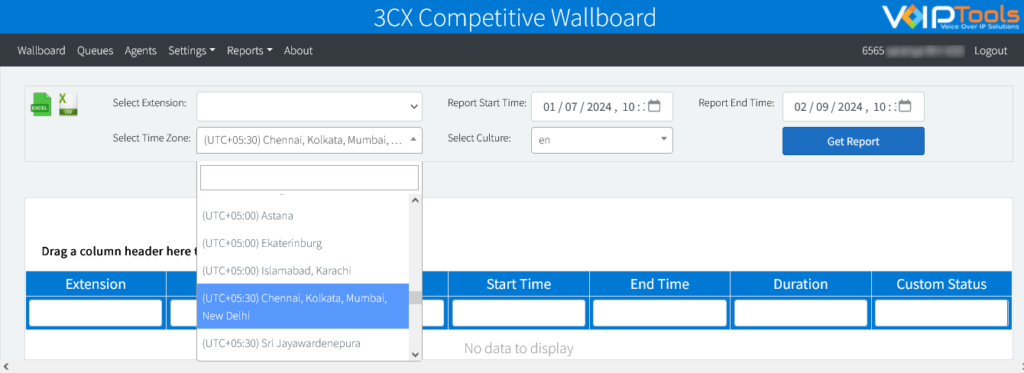
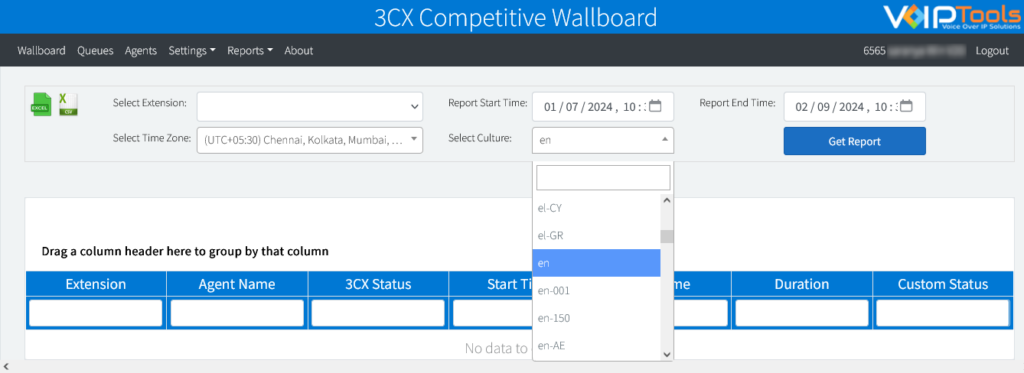
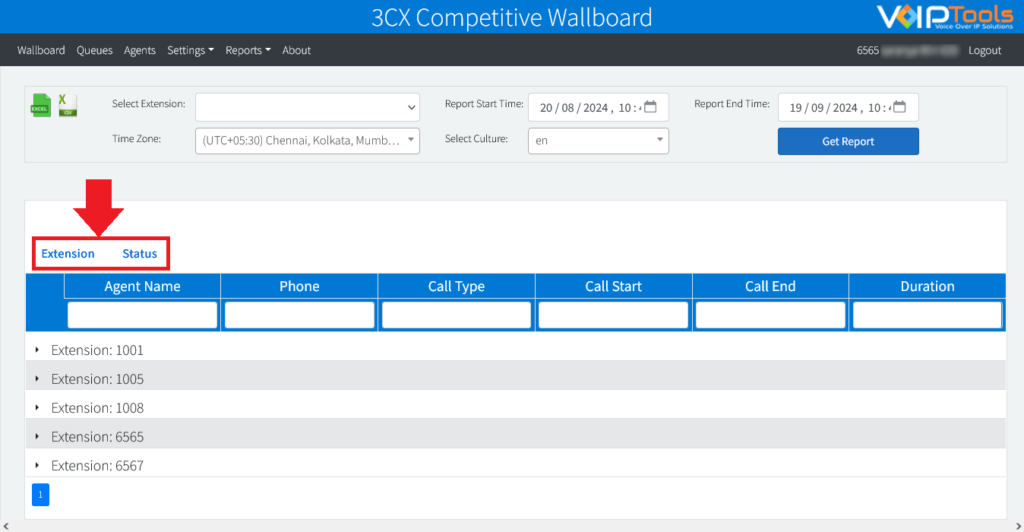
The Agent Status Report screen displays the history of the ‘Agent Status’ for all the agents. When an agent changes the status in the ‘3CX Smart Phone’, the status is instantly updated in the web portal. The updated status can be seen in the Presence Status Column of the Wallboard screen. Each incident of the change in Presence Status for an agent is recorded individually in the Agent Status Report.
You can organize the available columns into logical groups to enhance the professional presentation of your data. By doing so, you achieve a more refined perspective on your data.
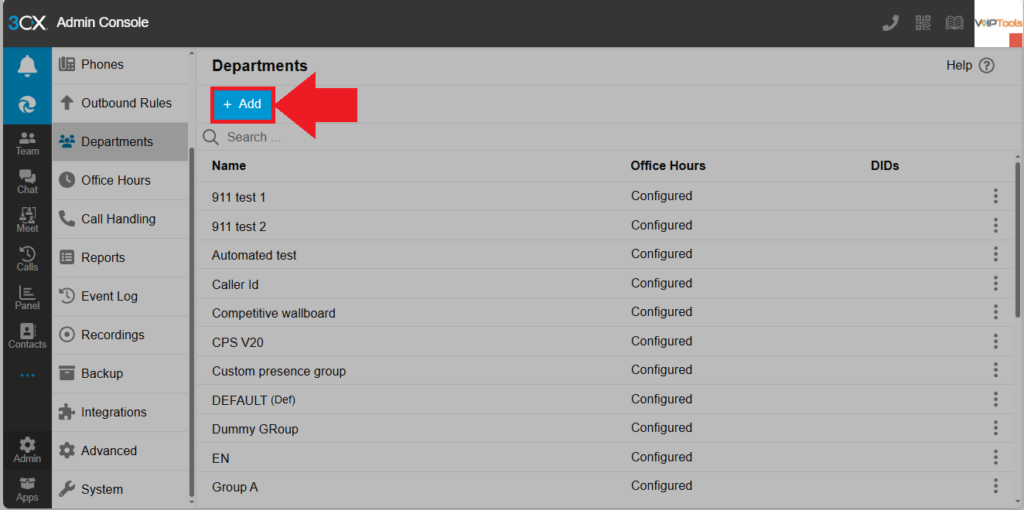
A 3CX Extension Group is needed to identify which extensions should be monitored for outbound call activities. A Wallboard manager is created by assigning the ‘manager’ role to a specific extension in the extension group.
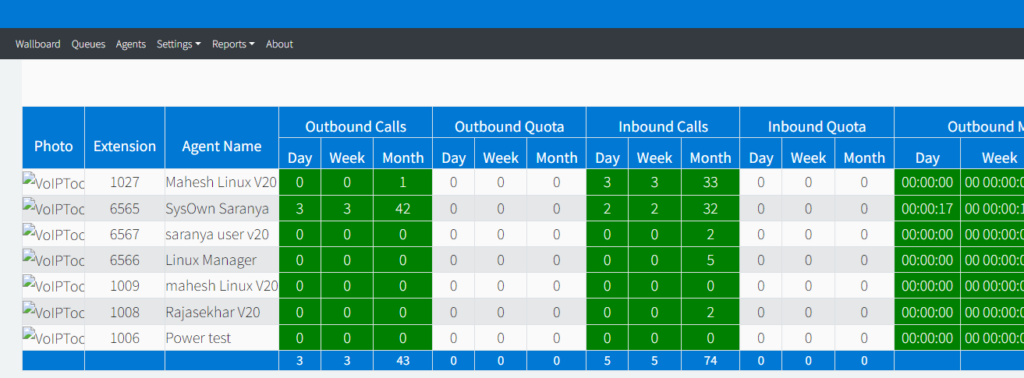
Figure 107: Wallboard Displaying the Created Extension Group
Need Support?
You get quick answers to most of your inquiries in our online manual. If you prefer direct contact, we offer various support channels, including phone, email, live chat, and our helpful VoIPTools forums.
Rest assured, our dedicated team is here to assist you around the clock, every day of the year. Whether you're based in the USA or India, we're ready to provide prompt responses to your technical queries.
Windows Event Log for VoIPTools Applications and Services #
For troubleshooting any application errors, our Windows Event Log contains a comprehensive list of error messages, warnings, and informative notes related to all our VoIPTools applications and services. It's a valuable resource to help you pinpoint and resolve any issues you may encounter.
Are you looking to collaborate with other VoIPTools customers facing similar challenges? Our forum is the perfect platform to exchange ideas, solutions, and best practices. Join the conversation at: https://www.voiptools.com/community/
Got questions that need immediate answers? Our chat support team is available to assist you in real time. Just click on the Live Chat button located at the lower right corner of our website, and we'll acknowledge your queries right away.
To ensure a thorough understanding of your concerns, email us at support@voiptools.com. Describe your issue in detail, and we'll get back to you within one business day with the support you need.
If you prefer to speak with a representative directly, you can reach us at +1 801-642-4655. Our attentive team is available to take your calls from 8:00 AM to 6:00 PM (Central Standard Time).
If you've purchased our products through a VoIPTools Partner, rest assured that they provide first-level support at no additional cost. Partners have access to 100% free technical assistance and actively participate in the troubleshooting process.
VoIPTools customers enjoy access to our online manuals and receive support through emails (with responses within one business day) and live chat. However, please note that we do not provide remote server login assistance.
For a more hands-on experience, consider our "Installation Support" package. Our expert support team can log in to your servers, and install and configure all our tools. This comprehensive service includes setting up SQL Server Express and Internet Information Server if necessary. We'll work closely with you to tailor our applications to meet your requirements.
We're committed to providing top-notch support to ensure your VoIPTools experience is smooth and hassle-free. Contact us today, and let us assist you in making the most of our powerful tools!
NOTE:
In the Wallboard screen, once you select an extension group that is not a part of the loop, the loop will break and the Wallboard will display data related to the selected group only. If you want to restart the loop, then select an extension group that is a part of the loop.
Use the three checkboxes in the center column to configure key visibility flags: Custom Status, Internal Calls, and Restrict Departments.
Figure 75: Custom Status, Internal Calls, and Restrict Departments Checkboxes
Checkbox
Default
What it controls
Custom Status
☑ Checked
Check this box to allow agents to define custom availability statuses. Disable this feature only if your organization requires strict adherence to standard system statuses.
Internal Calls
☐ Unchecked
Check this if you want extension-to-extension calls to appear in wallboard stats. Most teams leave this off so the board only reflects customer-facing activity.
Restrict Departments
☑ Checked
Check this to restrict agent visibility to selected Visible Departments; disable it to grant access to all departments.
This setting determines whether the system uses the Voicemail PIN or Web Client Password to authenticate your access to the web portal. Choose the option that aligns with your organization’s credential management policy.
Figure 75: Custom Status, Internal Calls, and Restrict Departments Checkboxes
Option
When to use it
Voice Mail PIN
Uses each agent’s voicemail PIN as the login password. Good choice if your team is already familiar with this credential.
Web Client Password
Uses the 3CX Web Client password instead. Select this if your organization manages web client credentials separately.
Figure 78: Work Hours Type – Regular and Shift Timings
Choose your schedule type. Select Regular for standard fixed hours, or Shifts for rotating or non-standard hours. If your contact center runs multiple shifts, select Shifts.
If you selected Shifts, set your Shift Start and End times. Click each time field and type or use the clock picker. The defaults are 12:00 AM to 11:59 PM, which covers the full day.
NOTE:
Regular shift is day shift and the timings are 12:00 AM to 11:59 PM
These four settings control how agents are ranked on the wallboard. Together they answer: “Rank by what, in which direction, over what time range, and ascending or descending?” Figure 78: Sort By, Sort Order, Sort By Range, and Sort Order Type Panels
Sort By: What metric to rank agents on
Option
Description
Calls
Ranks agents by total number of calls handled. The most common choice for competitive leaderboards.
Talk Time
Ranks agents by total time spent on calls.
Agent
Sorts alphabetically by agent name — useful when you just need a consistent, neutral order.
Sort Order: Which call direction to measure
Option
Description
Outbound
Stats based on calls made by agents.
Inbound
Stats based on calls received by agents.
Sort By Range: Time window for stats
Option
Description
Day
Today’s activity only. Best for daily competitions.
Week
Current week’s activity.
Month
Current month’s activity.
Sort Order Type: High-to-low or low-to-high
Option
Description
DESC
Highest performers appear at the top. This is the typical leaderboard format.
ASC
Lowest performers appear at the top — useful for identifying who may need support or coaching.
After updating any setting, click Save at the bottom of the panel. That stores the changes for the Wallboard.
You can save after updating a single setting, or make several changes in the General tab and save them together at the end.
The Grid Column tab lets you customize the visibility and order of grid columns, enhancing the display of relevant information. This feature empowers Managers and Admins to tailor grid views for their groups, improving data accessibility, organization, and overall user experience by displaying only the most pertinent information.
On the Settings dialog box, under Wallboard Grid Visible columns and Order list box, select the column that you want to reorganize in the wallboard screen and click the Left or the Right button to move the column to the left or right-hand side respectively.
In the Competitive Wallboard application, Managers and Admins have control over grid columns via the Grid Columns settings. Here are three general cases that explain how grid column changes affect different user groups.
When a Manager updates the grid columns, those changes apply to all members of their group. For example, if a Manager adjusts the grid settings, every user in that Manager’s group will see the updated columns.
A Manager can only modify the grid columns for their own group. However, if a Manager is also a member of another group, they can change the grid columns for that group as well.
When an Admin modifies the grid columns, the changes apply to the selected groups that the Admin is a part of. However, if the Admin is not a member of a particular group, the Admin cannot modify that group’s grid columns.
To check if the agent is successfully activated, you can confirm by displaying the wallboard screen. The agent should display in the list of monitored agents.
To confirm that the agent has been successfully inactivated, you can view the Wallboard screen. The inactivated agent should no longer display on the list of agents.
Select the Agents menu option and identify the record of the agent for whom you want to change the quota.
If you want to edit inbound call quota, click Inbound Day Quota or Inbound Week Quota or Inbound Month Quota depending on the type of inbound quota that you want to edit.
Similarly, if you want to edit outbound call quota, click Outbound Day Quota or Outbound Week Quota or Outbound Month Quota depending on the type of outbound quota that you want to edit.
The Wallboard screen provides a real-time overview of all active agents within a department name, displaying key call statistics such as outbound and inbound calls, call quotas, and agent statuses. It allows managers and agents to monitor performance, track quota achievements, and view idle time, ensuring efficient call handling and resource management.
The Wallboard screen can be viewed by agents who are assigned either ‘Manager’ or ‘Agent’ roles.
The Wallboard screen displays data as per the selected Department Name. In the Config Settings screen, if you have configured 3CX Extension Groups to display data according to the timer, then the Wallboard screen displays data of all the extension groups that are a part of the loop one after the other for a specified number of seconds.
In the Wallboard screen, once you select an extension group that is not a part of the loop, the loop will break and the Wallboard will display data related to the selected group only. If you want to restart the loop, then select an extension group that is a part of the loop.
If you have configured a Group Message for desired extension group in the Agents screen, then the Wallboard screen displays the group message when you select that group from the Extension Group Name dropdown list.
The Wallboard screen displays the list of all the agents associated to the group that you select from the Extension Group Name drop-down list.
Depending on the Sort Order setting (Inbound/ Outbound) that you have selected in the Settings screen, the Wallboard screen displays the agent’s information in the following way:
If the Sort Order setting is Outbound, then the agents will be displayed in descending order based on the outbound call count.
If the Sort Order setting is Outbound and if the daily outbound call count for any two agents is the same, then the agent with the highest Outbound Talk Time for the day will be displayed above the other agent.
If the Sort Order setting is Inbound and if the daily inbound call count for any two agents is the same, then the agent with the highest Inbound Talk Time for the day will be displayed above the other agent.
The footer of the Wallboard screen displays the sum of outbound calls of all the agents per day/ week/ month, sum of inbound calls of all the agents per day/ week/ month, and the average percentage of answered inbound/ outbound calls of all the agents per day.
The Wallboard screen displays Idle Time data only when you select Work hours type as Shifts in the Settings page. Idle Time is an active timer that runs to display the amount of idle time of an agent during shift hours.
Presence displays the current Agent Status and the Time since the latest updated Agent Status in the ‘3CX Smart Phone’.
The agent’s profile picture as stored in the 3CX system or uploaded via the Settings page. Displayed as a thumbnail for quick visual identification of the agent in each row.
Extension ID
The unique numeric identifier assigned to the agent’s phone line within the 3CX PBX (e.g., 1310, 6566, 2120). Used to route calls directly to the agent. Must be unique across the entire system.
Agent Name ID
The full display name of the agent as registered in the 3CX directory. Used throughout the wallboard for identification in reports, queue assignments, and status tracking.
Call activity metrics
Missed Calls InboundCount
The total number of inbound calls that rang to this agent but were not answered during the current tracking period. A high value may indicate the agent is unavailable, in Do Not Disturb mode, or overwhelmed by concurrent calls.
Talk Time InboundDuration
The cumulative duration of all completed inbound calls handled by the agent during the current period. Displayed in HH:MM:SS format. A primary indicator of inbound call workload.
Average Length InboundDuration
The mean duration of all inbound calls received by the agent. Calculated by dividing total inbound talk time by the number of completed inbound calls. Useful for benchmarking call handling consistency.
Average Length OutboundDuration
The mean duration of all outbound calls placed by the agent. Calculated by dividing total outbound talk time by the number of completed outbound calls. Helps identify patterns in outbound call strategy.
Total Calls InboundCount
The total number of inbound calls successfully answered by the agent during the current tracking period. Excludes missed or rejected calls. A primary KPI for inbound call volume and availability.
Total Calls OutboundCount
The total number of outbound calls placed by the agent during the current tracking period. Includes all completed outbound calls regardless of duration. Tracks proactive outreach activity.
Idle time
Idle Time — Current Timer
The continuous duration the agent has been idle since their last call ended or status changed. Displayed as a live running timer in DD HH:MM:SS format. Resets to zero each time the agent begins a new call or changes status.
Idle Time — Today Timer
The cumulative total time the agent has spent idle since midnight of the current business day. Unlike Current Idle Time, this counter does not reset between calls — it accumulates throughout the full shift and resets at midnight.
Status & presence
Phone Status Status
The real-time telephony state of the agent’s extension as reported by the 3CX PBX. Indicates whether the line is currently free or active. Typical values: Available and On a Call. Updated live by the 3CX engine.
3CX Status PresencePresence
The agent’s self-reported presence state within the 3CX client. Set manually by the agent or automatically by schedule rules. Common values: Available, Away, Do Not Disturb, Out of Office, Lunch. Independent of Phone Status — an agent can be telephony-available but marked Away.
Time Presence durationPresence
The elapsed time the agent has been in their current 3CX presence state. Displayed in DD HH:MM:SS format. Resets each time the presence state changes. Useful for identifying agents who have been in a non-available state for an extended period.
The Queues screen provides an overview of call queue activities for the current day, focusing specifically on inbound external calls. It displays key metrics such as the number of calls waiting, agents available, agents busy, answered calls, abandoned calls, total calls, and average wait time. This information helps in effectively managing call queues and ensuring efficient call handling.
The unique numeric identifier assigned to the queue within the 3CX PBX system (e.g., 8038, 8043). Callers dial this number — or are routed to it — to enter the queue. Must be unique across the system and is used in the Select Queues for Monitoring filter.
Queue Name ID
The descriptive label given to the queue in the 3CX configuration (e.g., “Competitive Wallboard”, “VoIPTools Technical Support”). Provides human-readable context for identifying the purpose or team associated with each queue number.
Real-time queue activity
Calls Waiting Live
The number of callers currently on hold in the queue waiting to be connected to an available agent. Updates in real time. A persistently high value indicates insufficient agent availability relative to incoming call volume.
Agents Available Live
The number of agents currently logged into the queue with a status that allows them to receive calls (i.e., not busy, not in Do Not Disturb, and not paused). Reflects the real-time capacity of the queue to handle waiting or incoming calls.
Agents Busy Live
The number of agents assigned to this queue who are currently engaged in an active call. Together with Agents Available, this gives a complete picture of current agent utilization within the queue at any given moment.
Call volume counters
Answered Calls Count
The total number of calls routed to this queue that were successfully connected to and answered by an agent during the current tracking period. Excludes abandoned calls. A key measure of queue throughput and agent responsiveness.
Abandoned Calls Count
The total number of callers who entered the queue but disconnected before being connected to an agent during the current tracking period. High abandonment rates typically indicate long wait times or insufficient staffing. A critical metric for assessing caller experience.
Total Calls Today Count
The cumulative total of all calls that entered this queue since midnight of the current business day, including answered, abandoned, and any transferred calls. Provides an overall picture of daily inbound demand for the queue. Resets at midnight.
Performance metrics
Average Wait Time Inbound queueDuration
The mean time callers spend waiting in the queue before being connected to an agent, displayed in HH:MM:SS format. Calculated across all answered calls in the current tracking period. A primary indicator of queue efficiency and caller experience quality.
Answered Calls SLA Service Level AgreementCount
The number of answered calls that met the configured SLA threshold — meaning they were answered within the target response time (e.g., within 30 seconds). Used alongside SLA% to evaluate whether the queue is consistently meeting its service standard.
SLA% Service Level AgreementPercentage
The percentage of total calls answered within the pre-configured SLA time threshold. Calculated as: (Answered Calls SLA ÷ Total Calls) × 100. A common benchmark is 80% of calls answered within 30 seconds. The primary KPI for measuring overall queue service quality and team performance.
The Reports screen provides comprehensive tools for exporting data and viewing detailed reports on call activities and agent statuses. It includes options like the Call Log Report and Agent Status Report, allowing managers to filter, view, and export data in various formats such as PDF, XLS, and CSV. This functionality supports efficient tracking and analysis of call metrics and agent performance over time.
The Call Log Report screen displays list of all the calls placed by the agents. You can also view the list of call records for a specific day by selecting the desired date in Call Start and Call End date pickers. The log contains details including ‘Agent Name’, ‘Extension’, ‘Call Status’, ‘Call Duration’ etc.
The Call Log Report screen lets you generate call log report for the desired range and export data in various formats. You can also export the reports for a particular extension.
The Call Log Report screen displays list of all the calls placed by the agents. You can also view the list of call records for a specific day by selecting the desired date in Call Start and Call End date pickers. The log contains details including ‘Agent Name’, ‘Extension’, ‘Call Status’, ‘Call Duration’ etc.
The Agent Status Report screen displays the history of the ‘Agent Status’ for all the agents. When an agent changes the status in the ‘3CX Smart Phone’, the status is instantly updated in the web portal. The updated status can be seen in the Presence Status Column of the Wallboard screen. Each incident of the change in Presence Status for an agent is recorded individually in the Agent Status Report.
You can organize the available columns into logical groups to enhance the professional presentation of your data. By doing so, you achieve a more refined perspective on your data.
A 3CX Extension Group is needed to identify which extensions should be monitored for outbound call activities. A Wallboard manager is created by assigning the ‘manager’ role to a specific extension in the extension group.


NOTE:


 button to download your application.
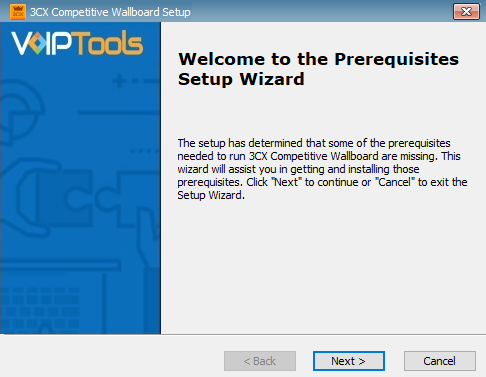
 desktop icon to open the web application.
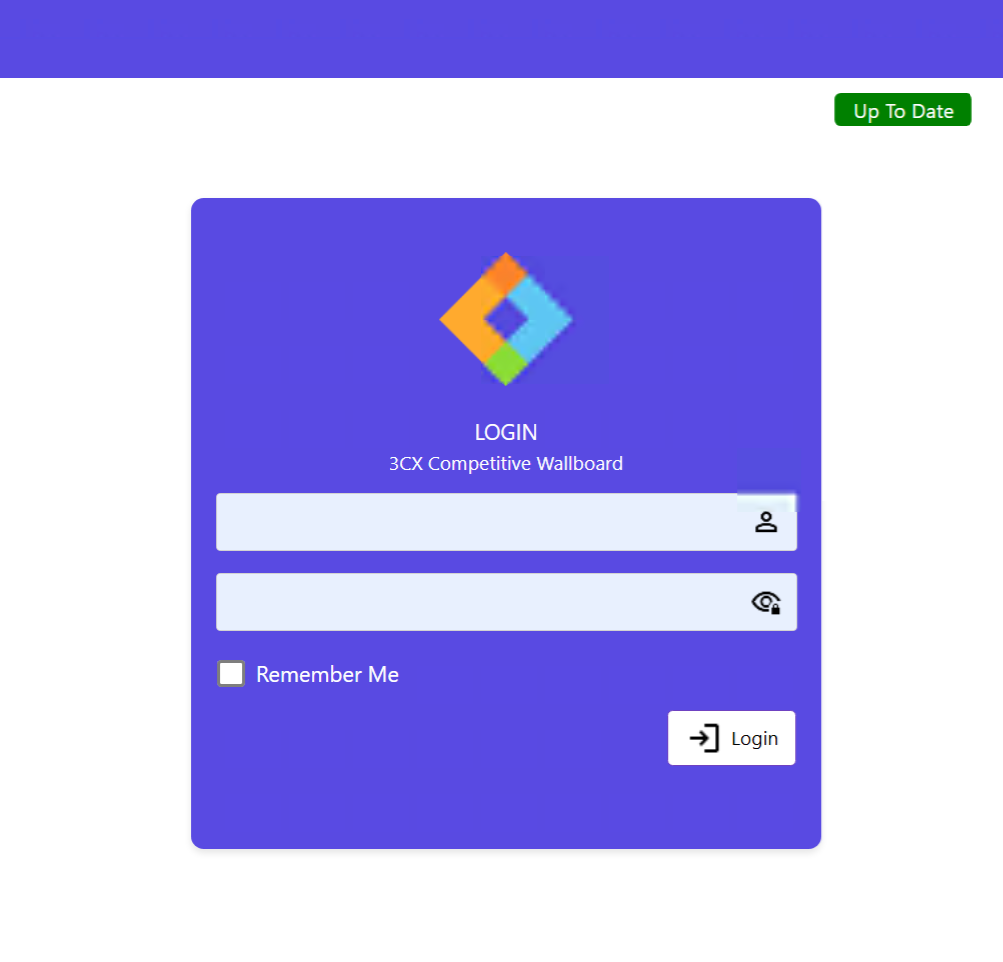
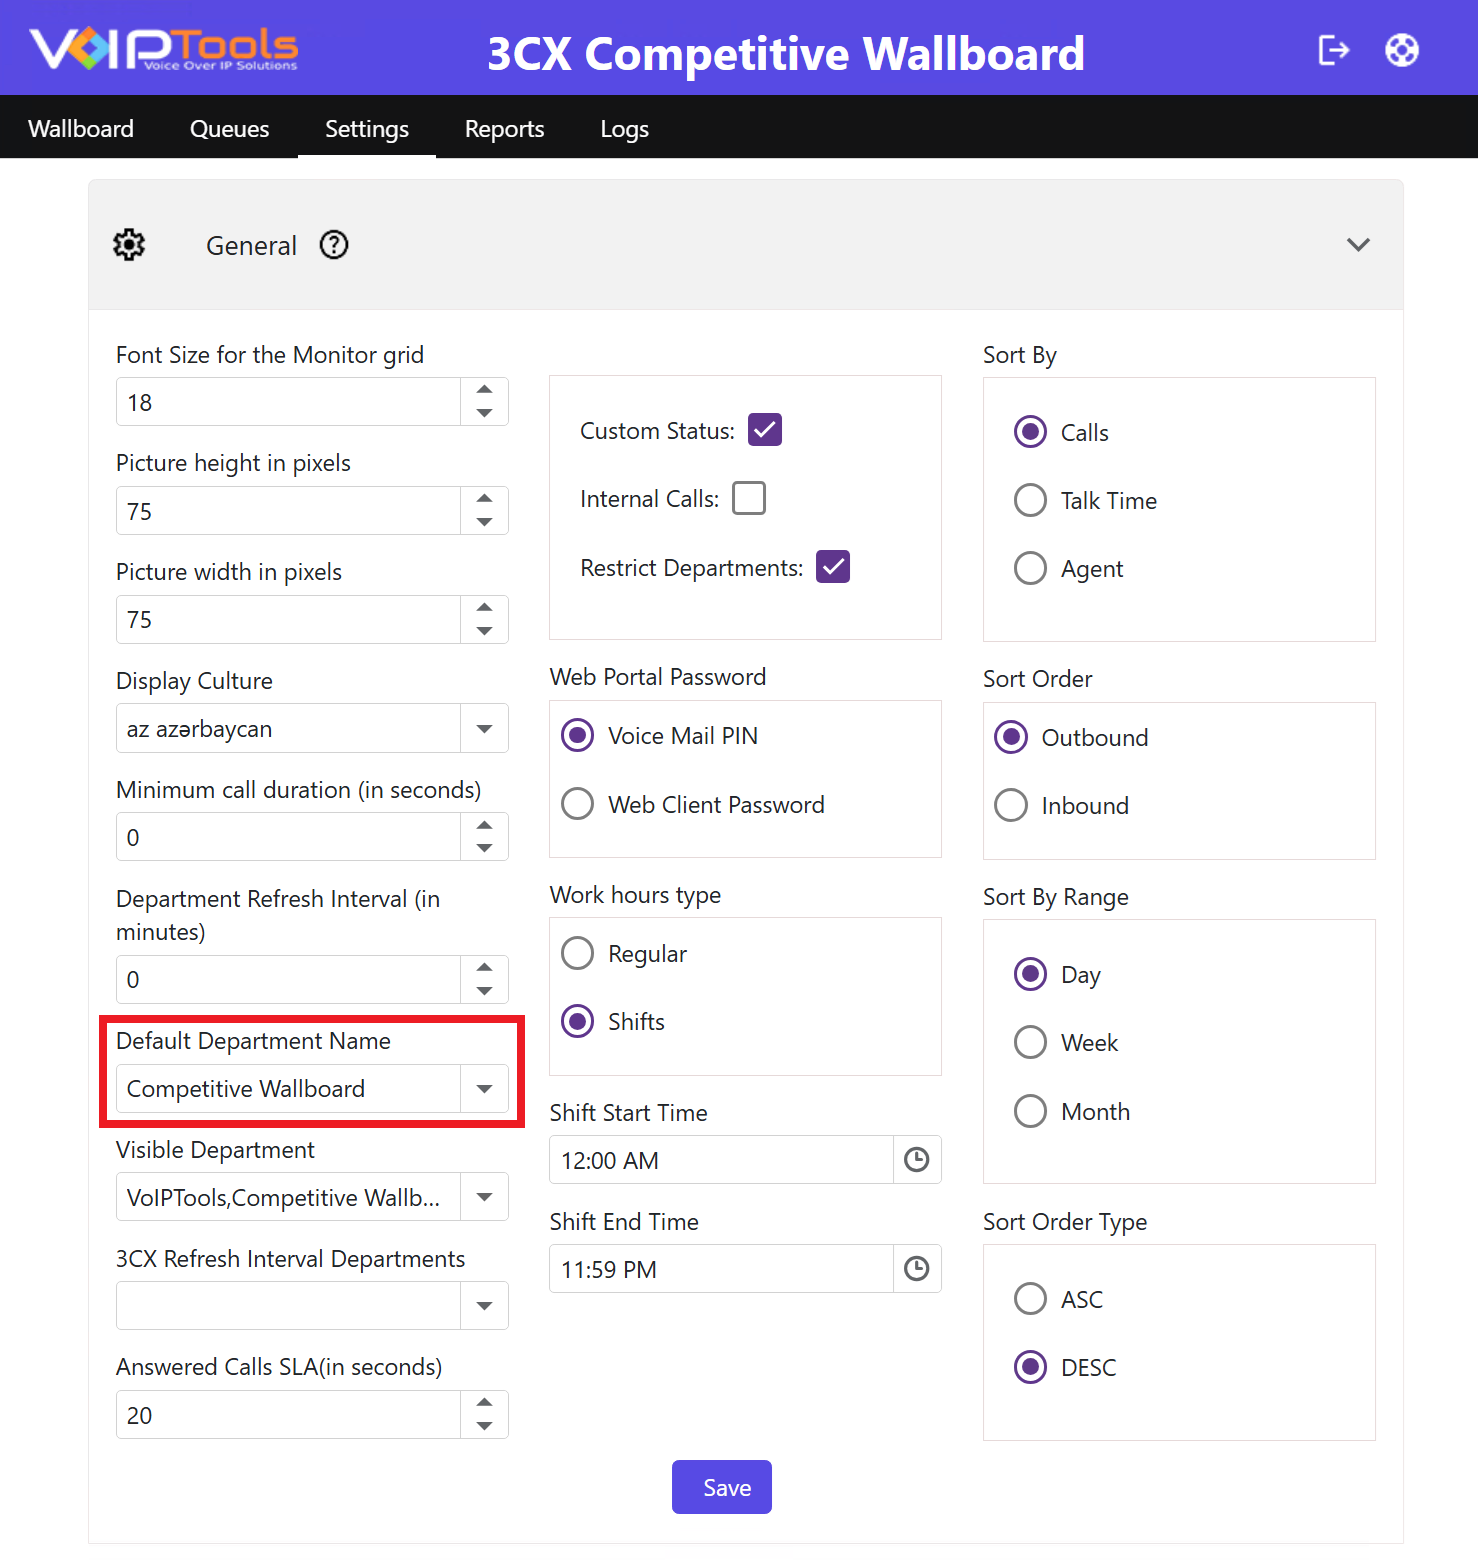
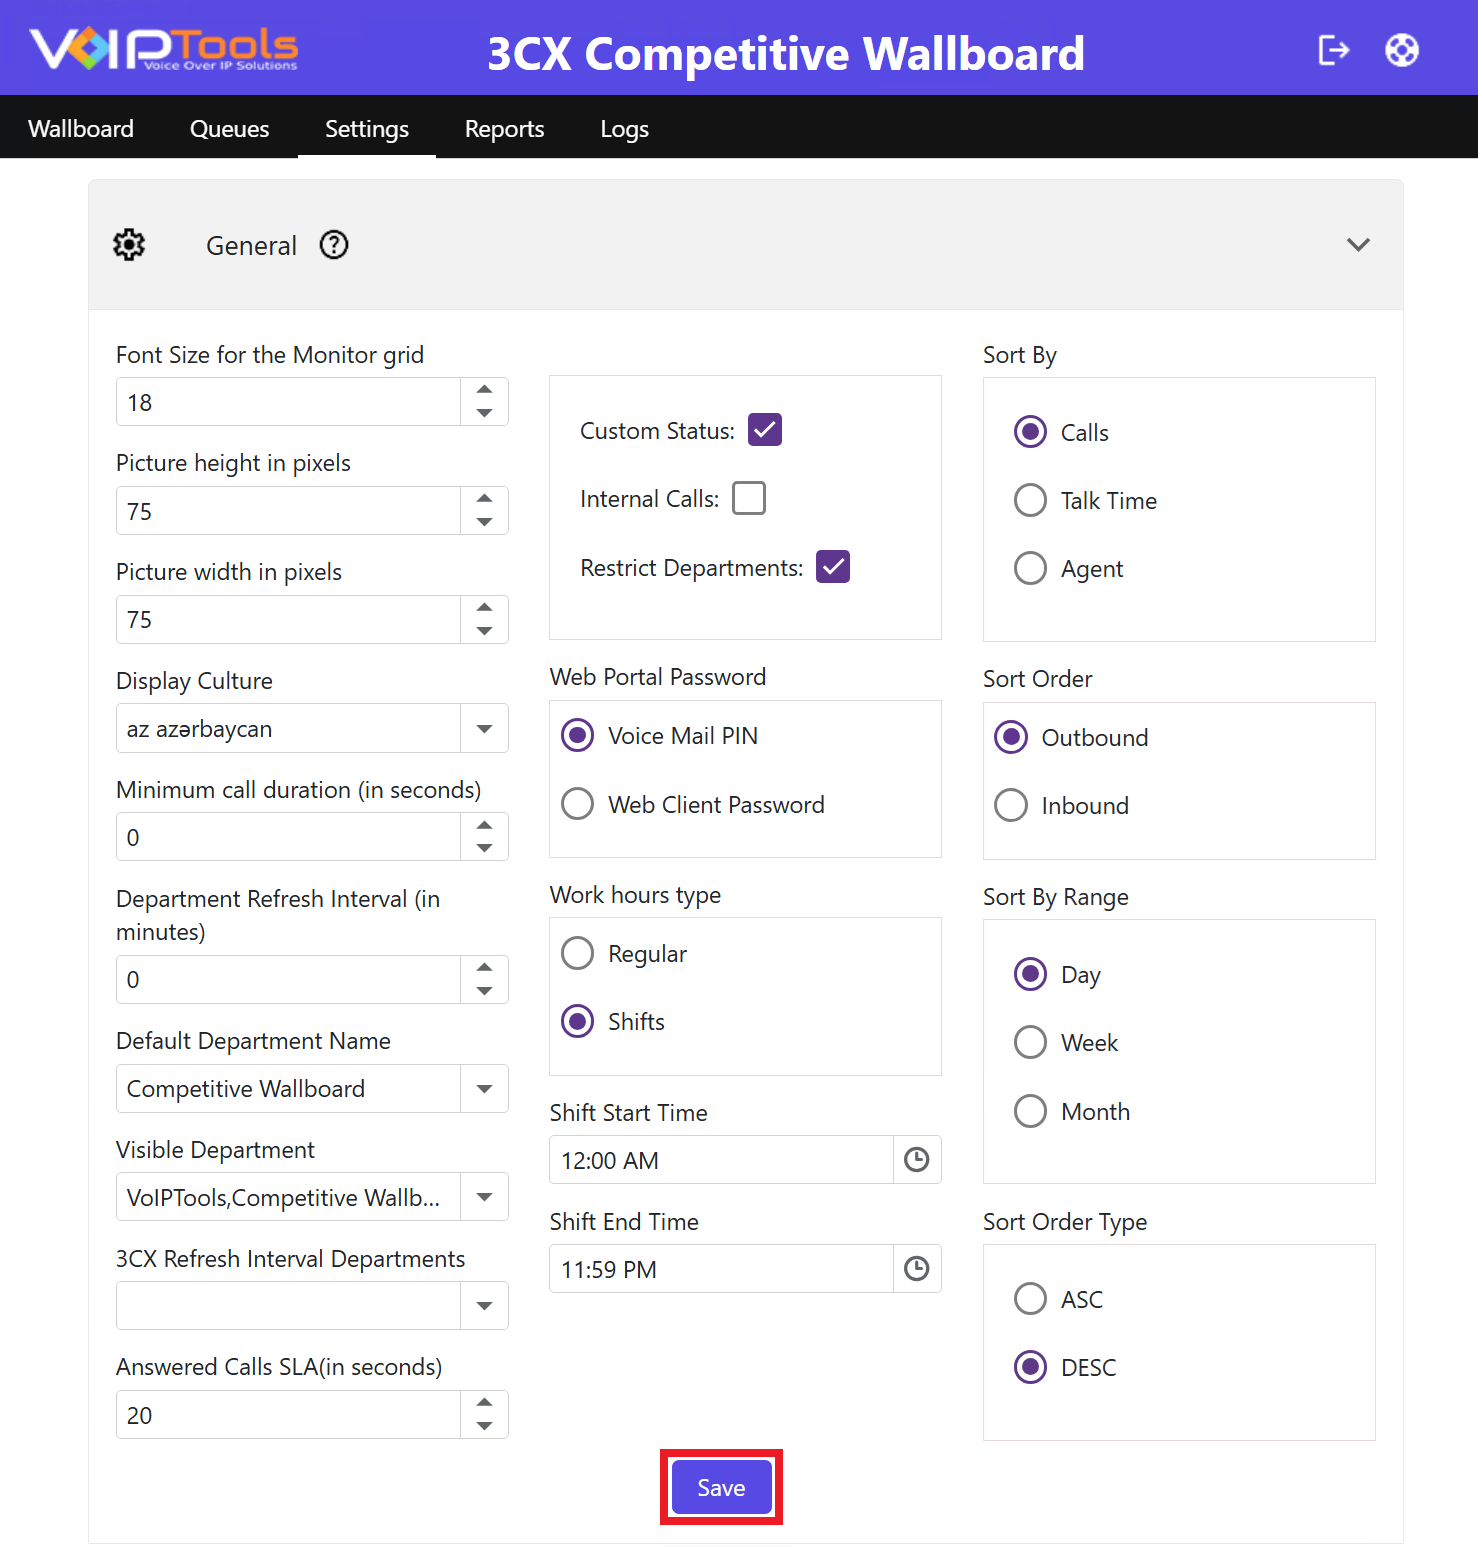
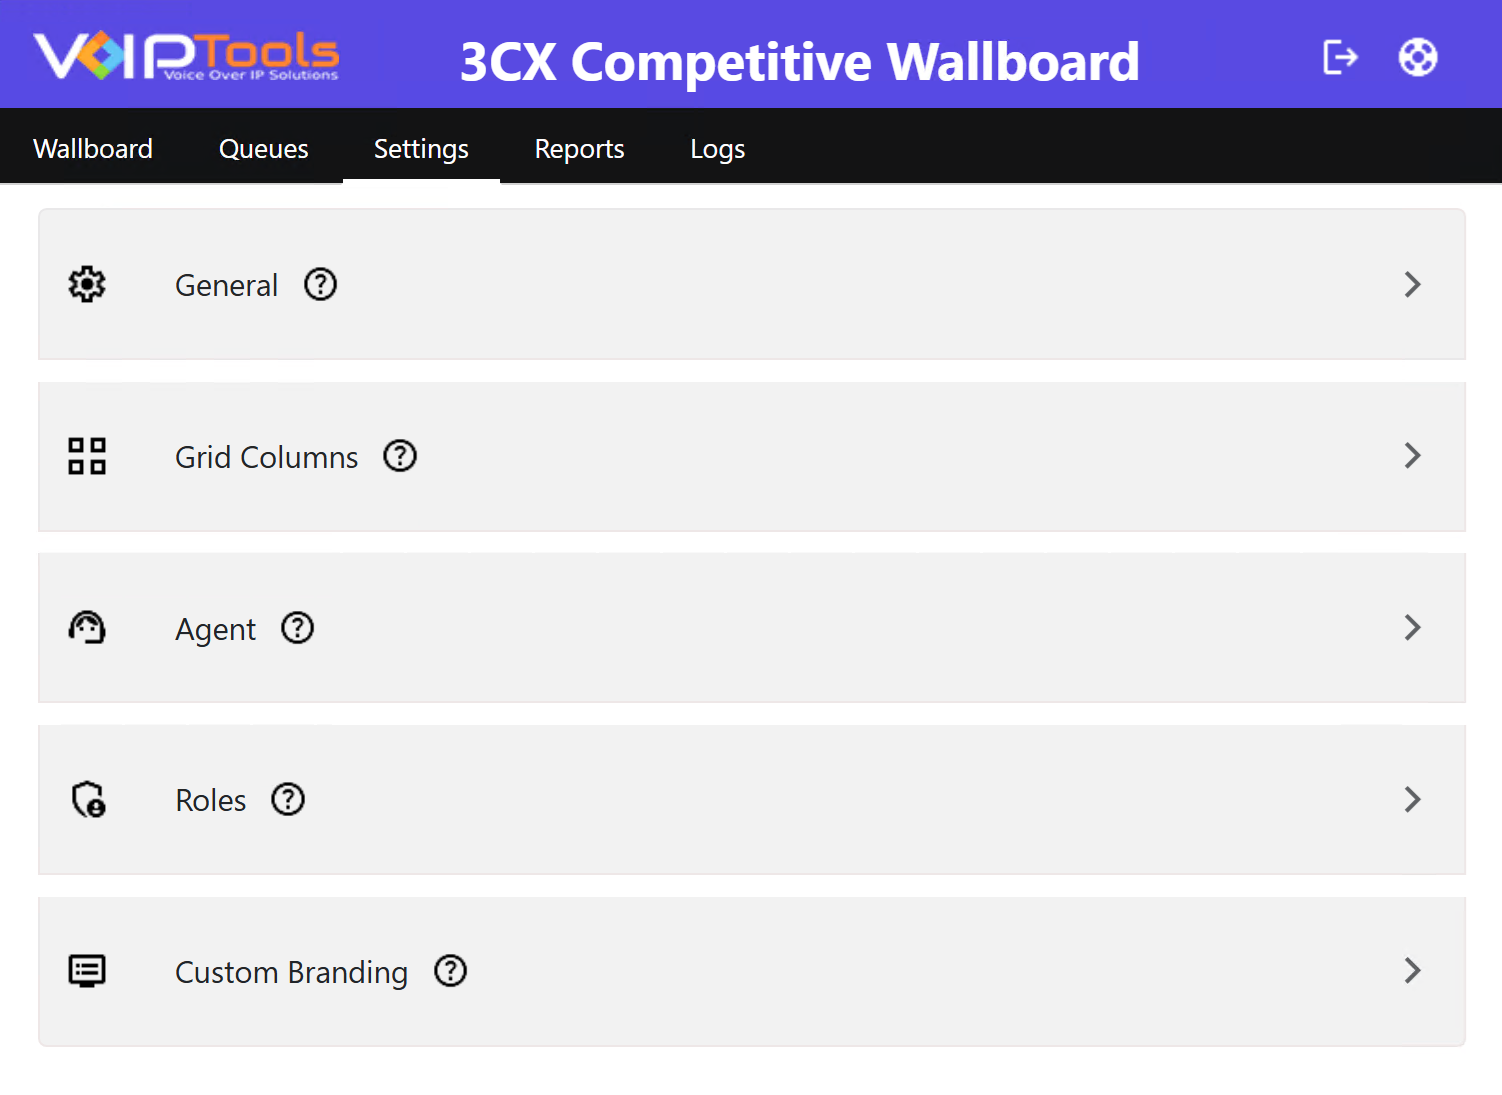 Figure 66: Settings Menu Overview
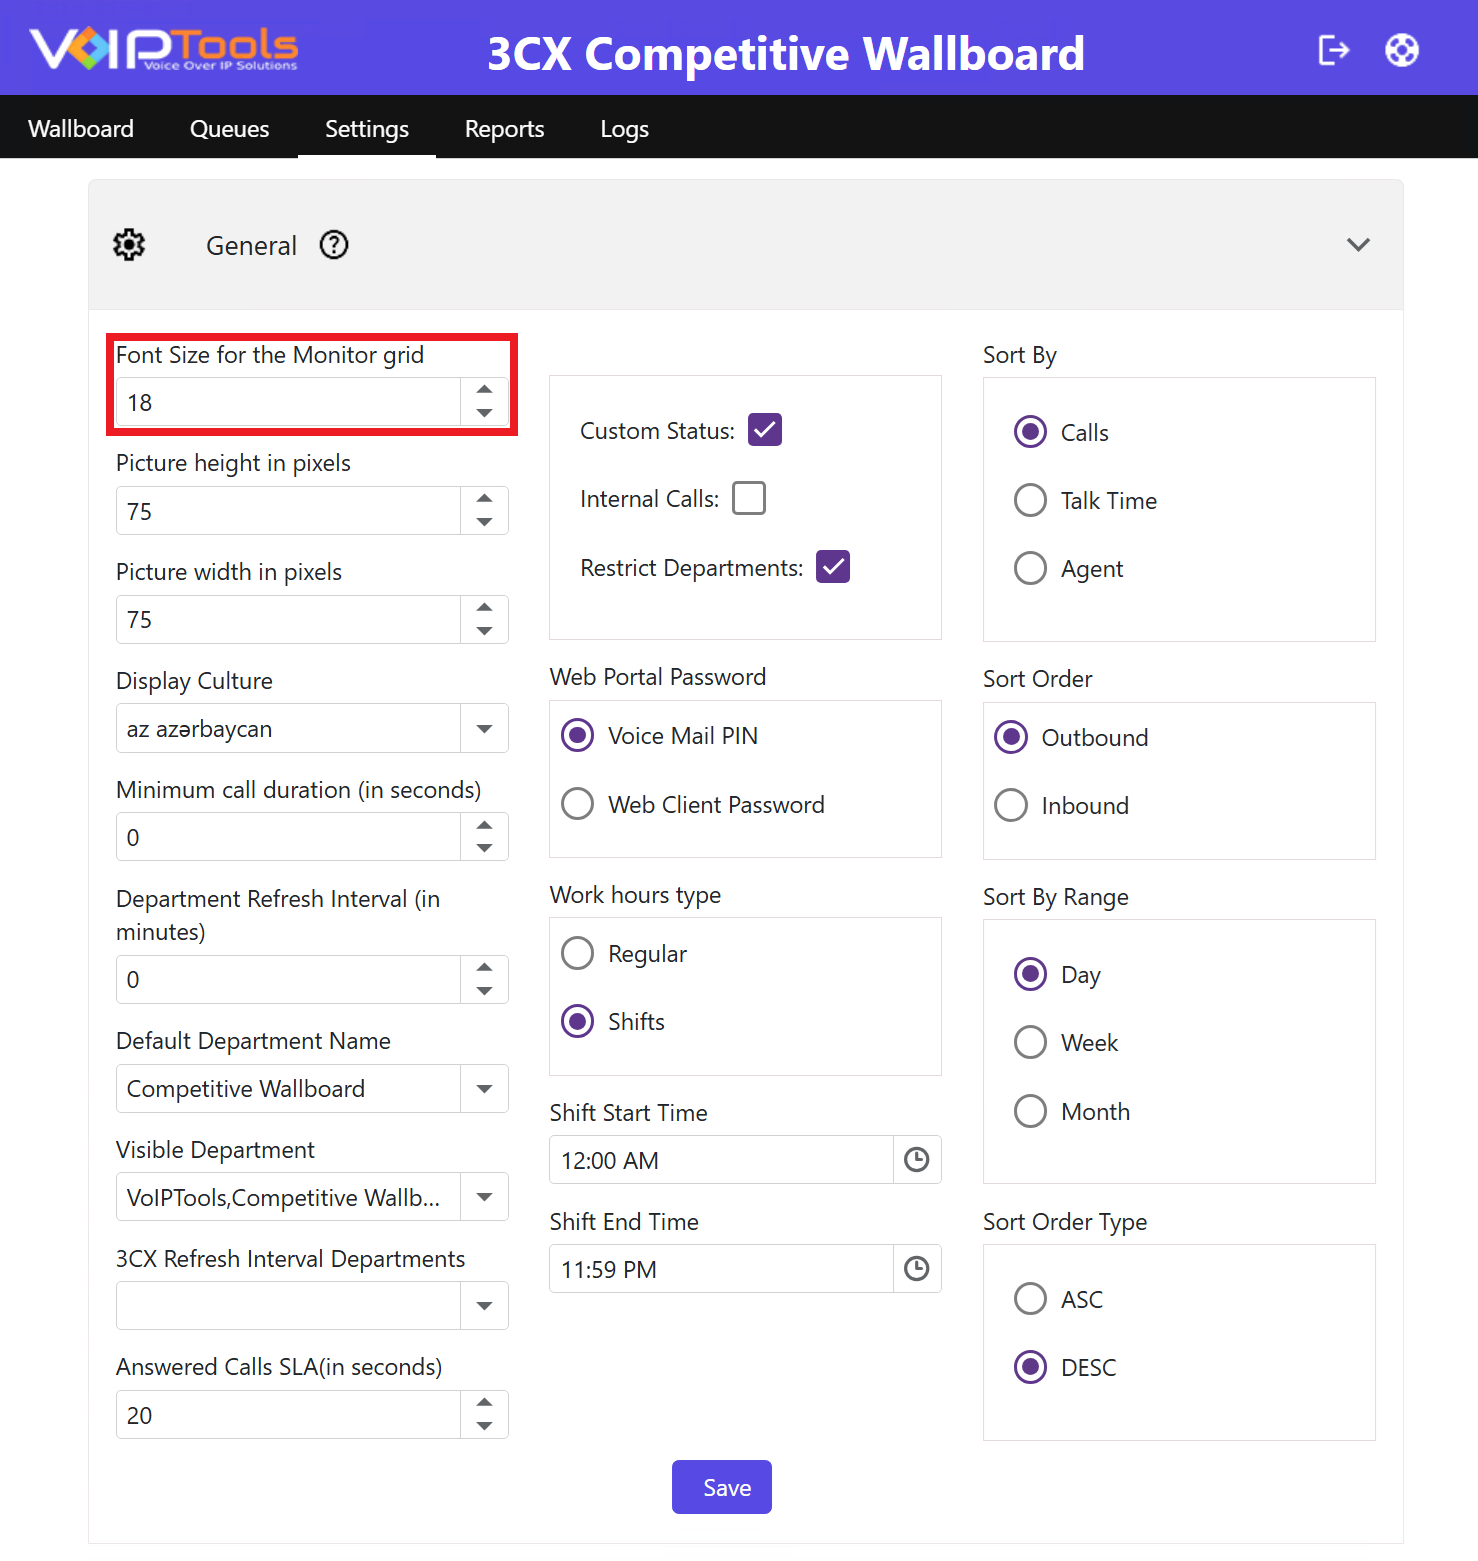
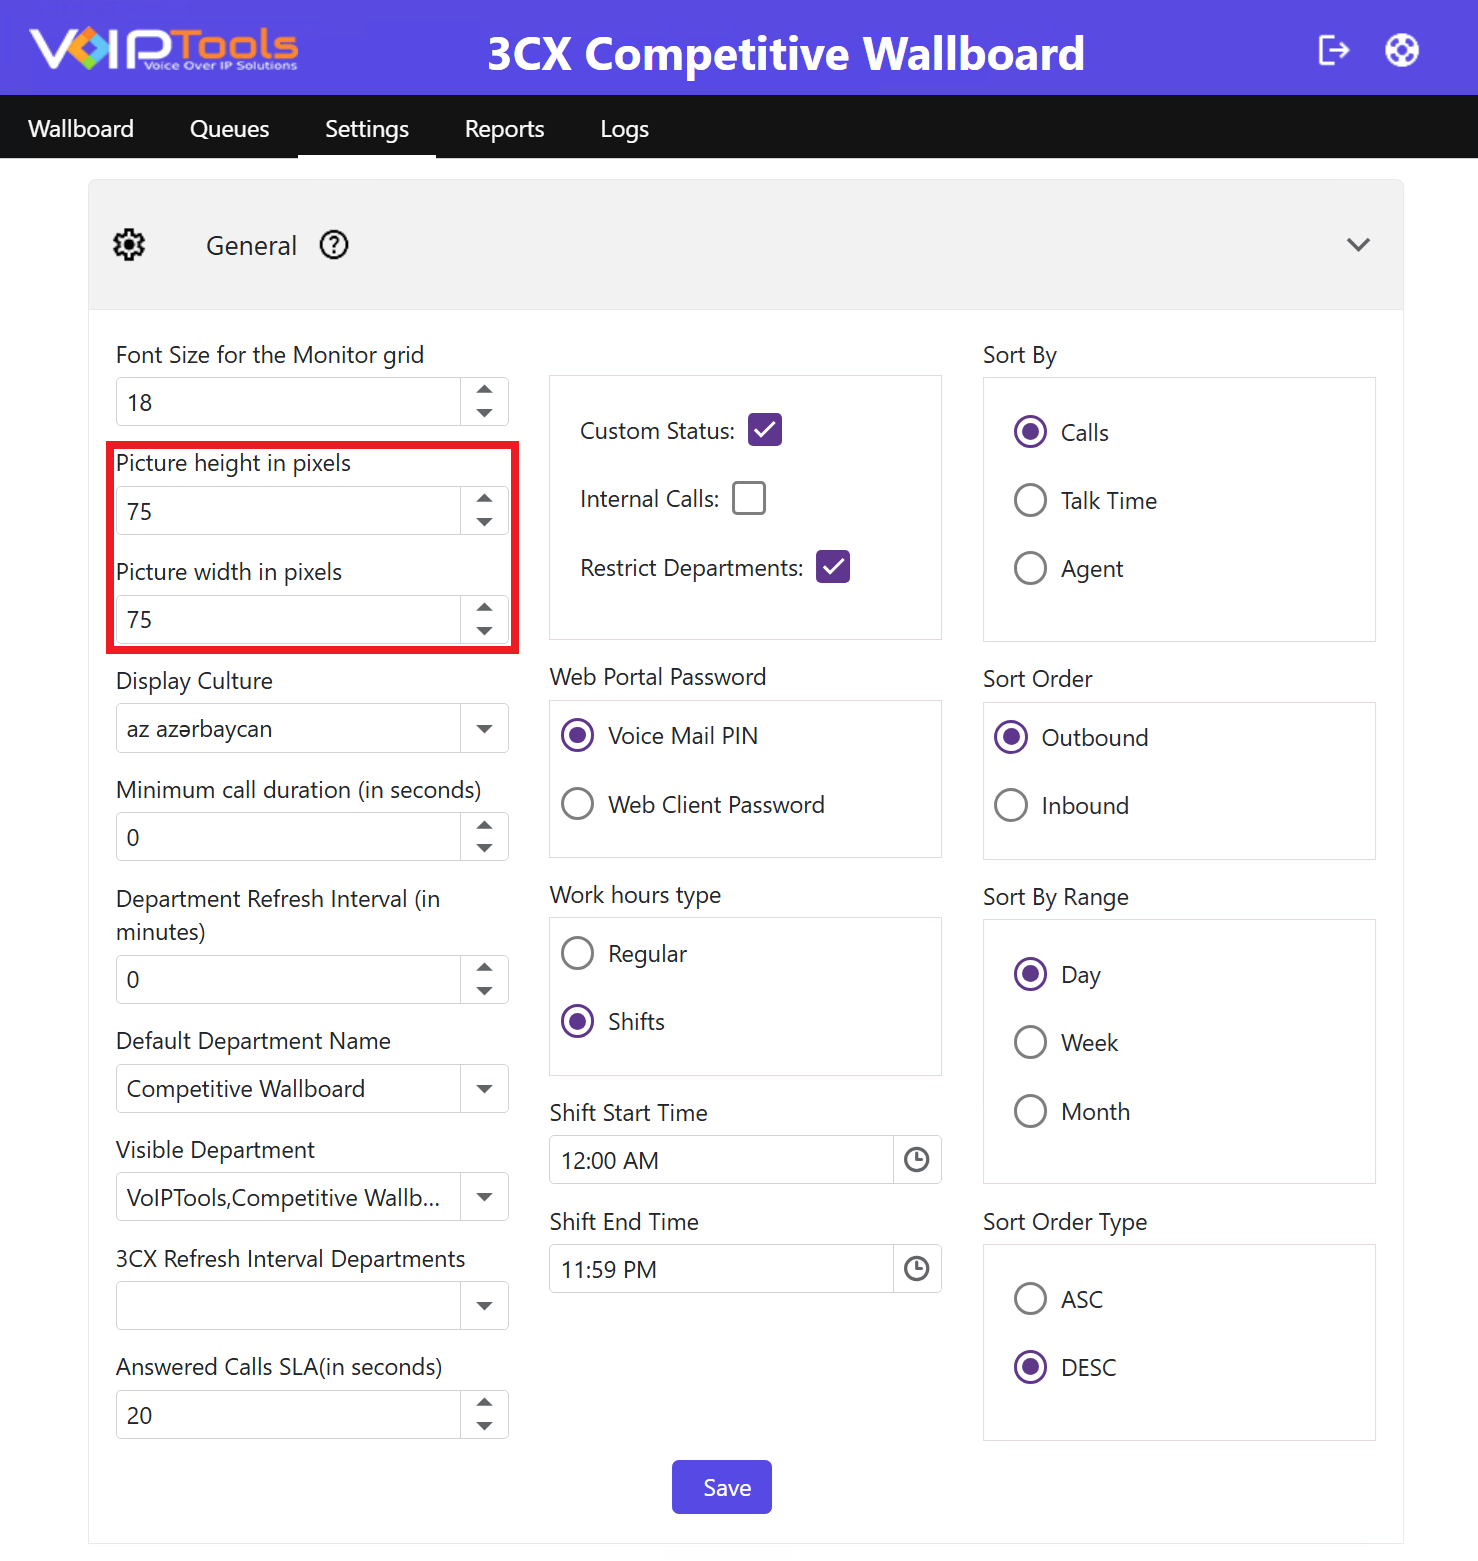 Figure 68: Font Size Settings
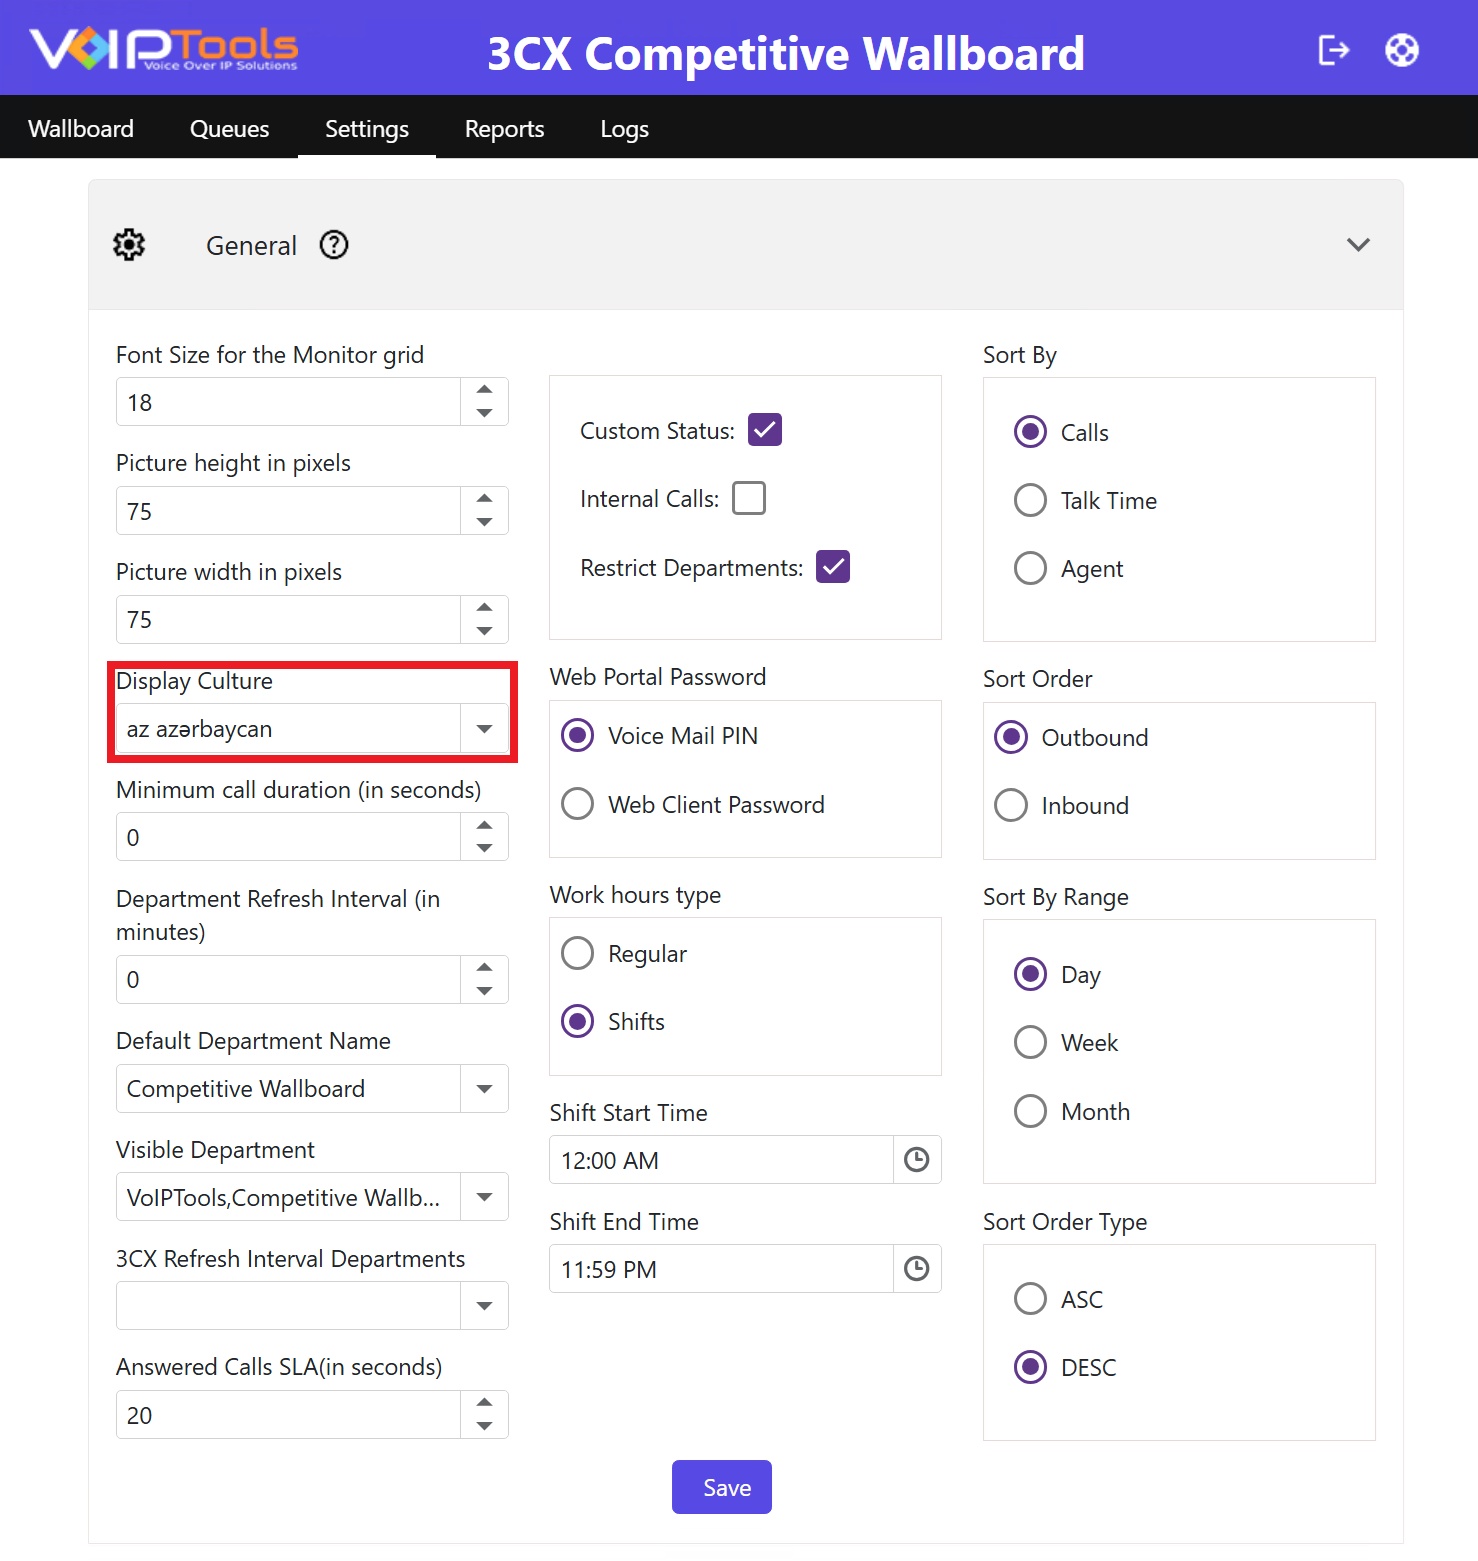
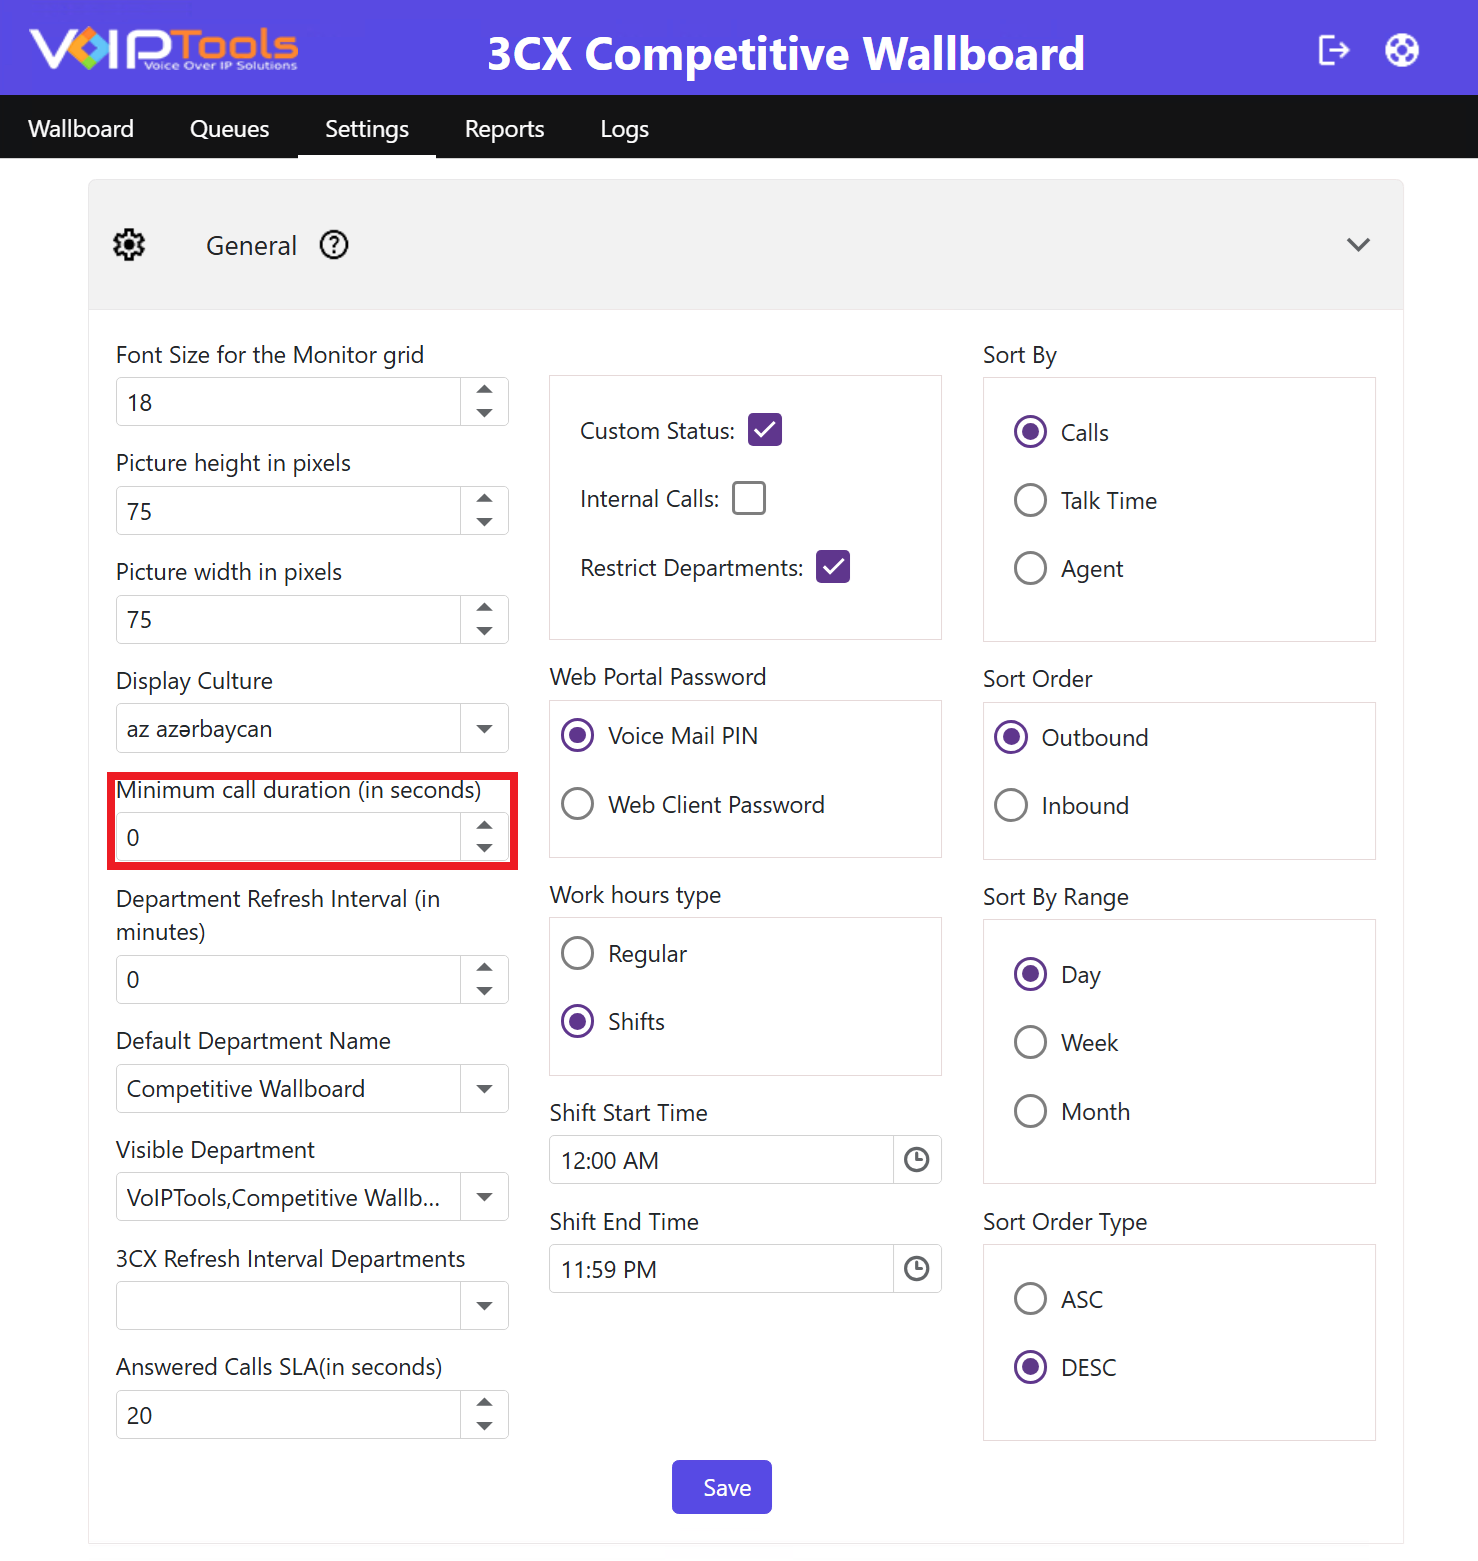
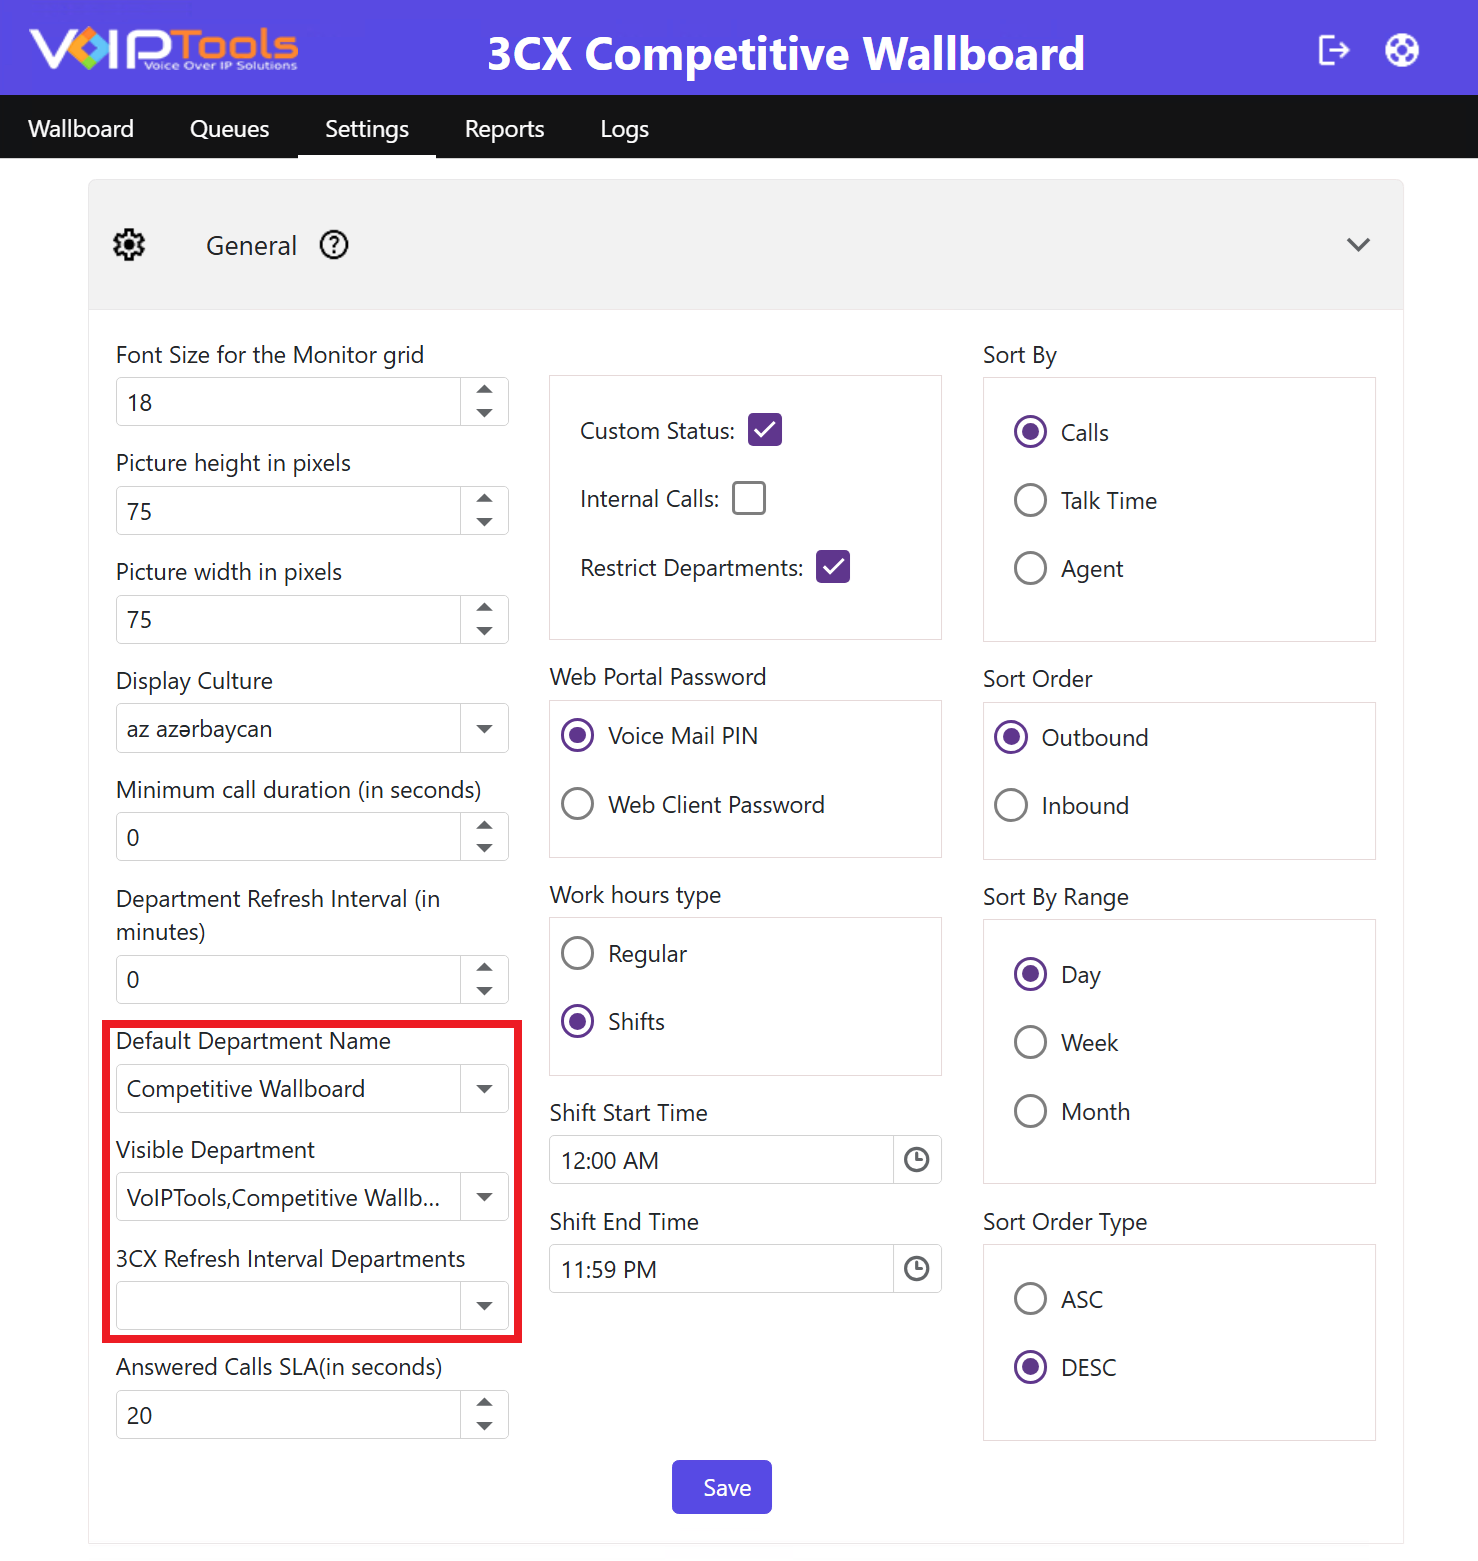 Figure: Restrict Departments Box
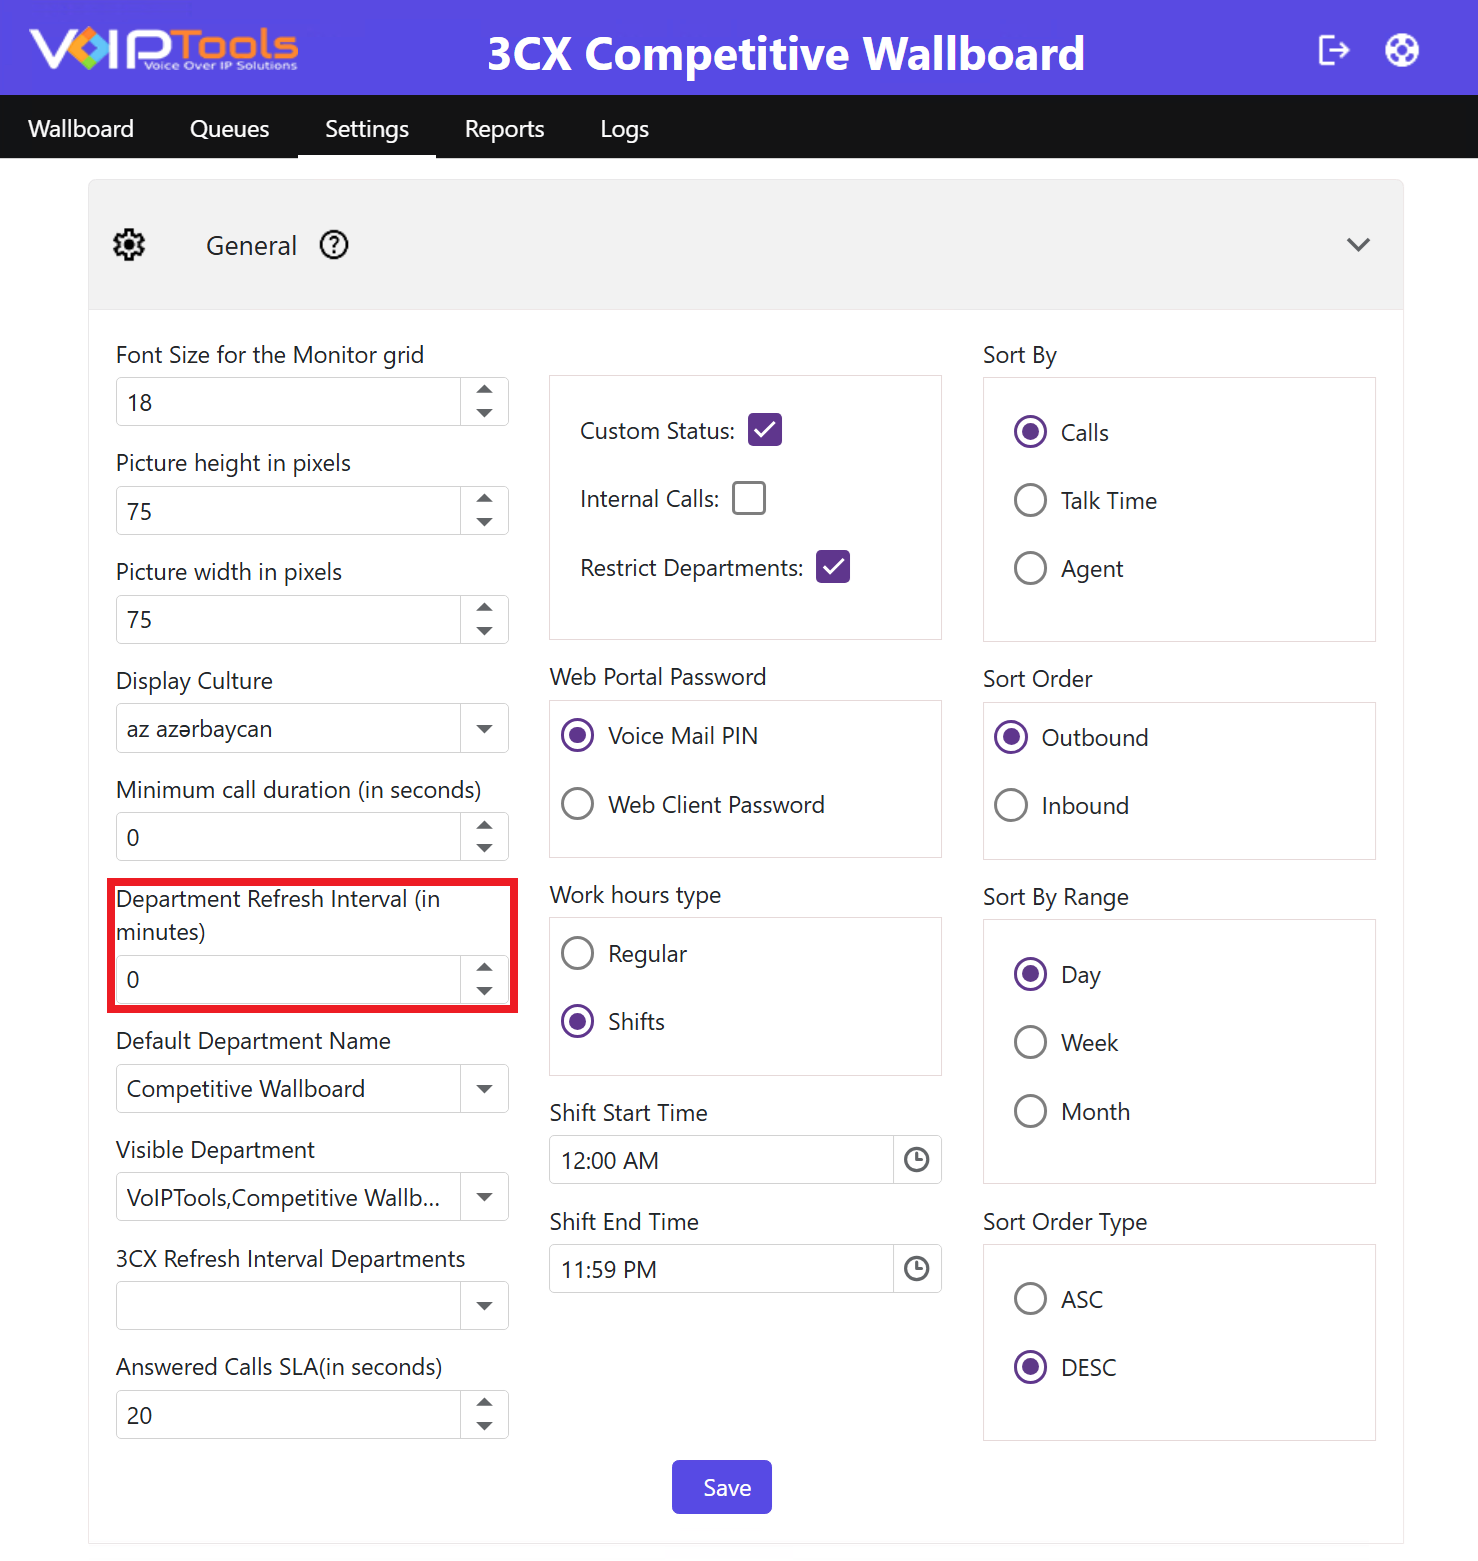
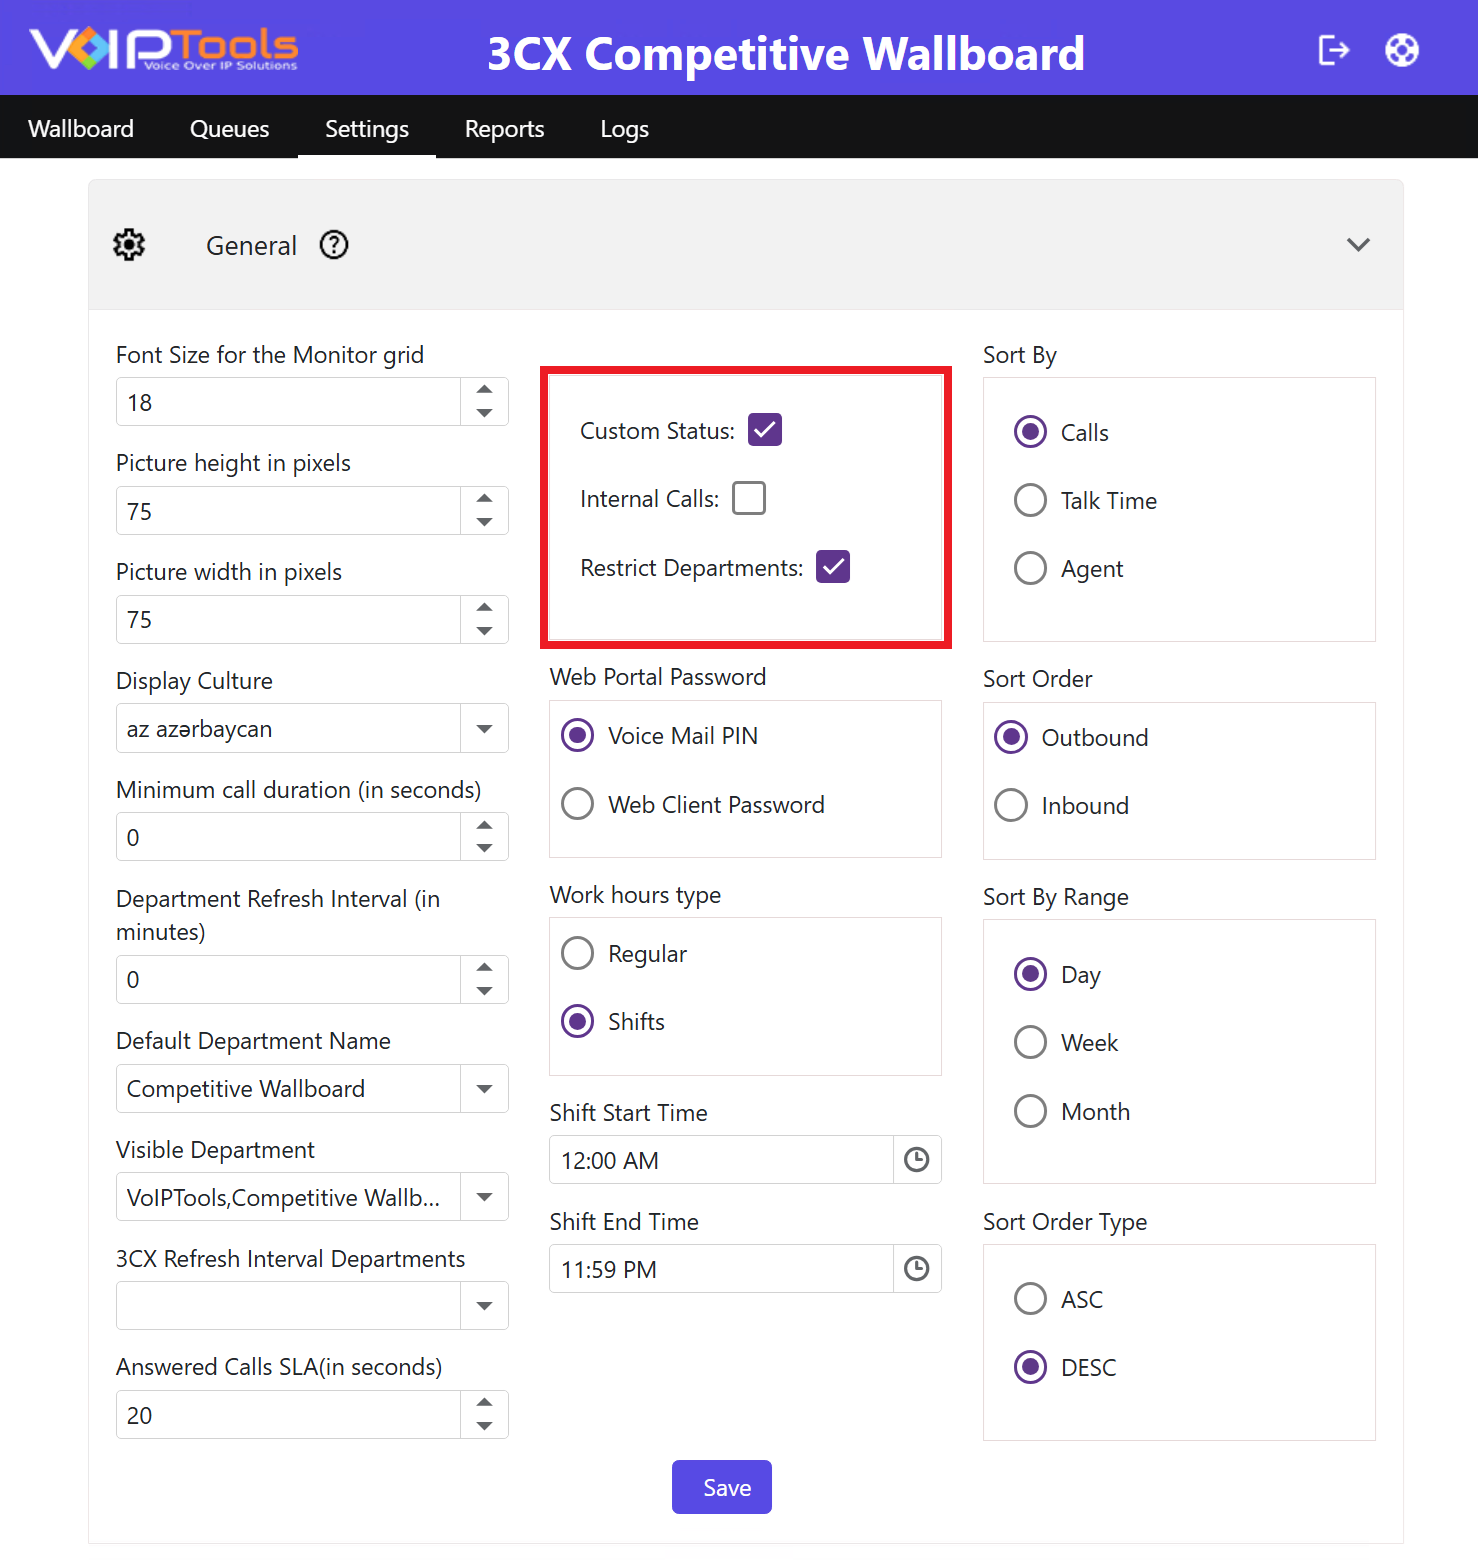 Figure 75: Custom Status, Internal Calls, and Restrict Departments Checkboxes
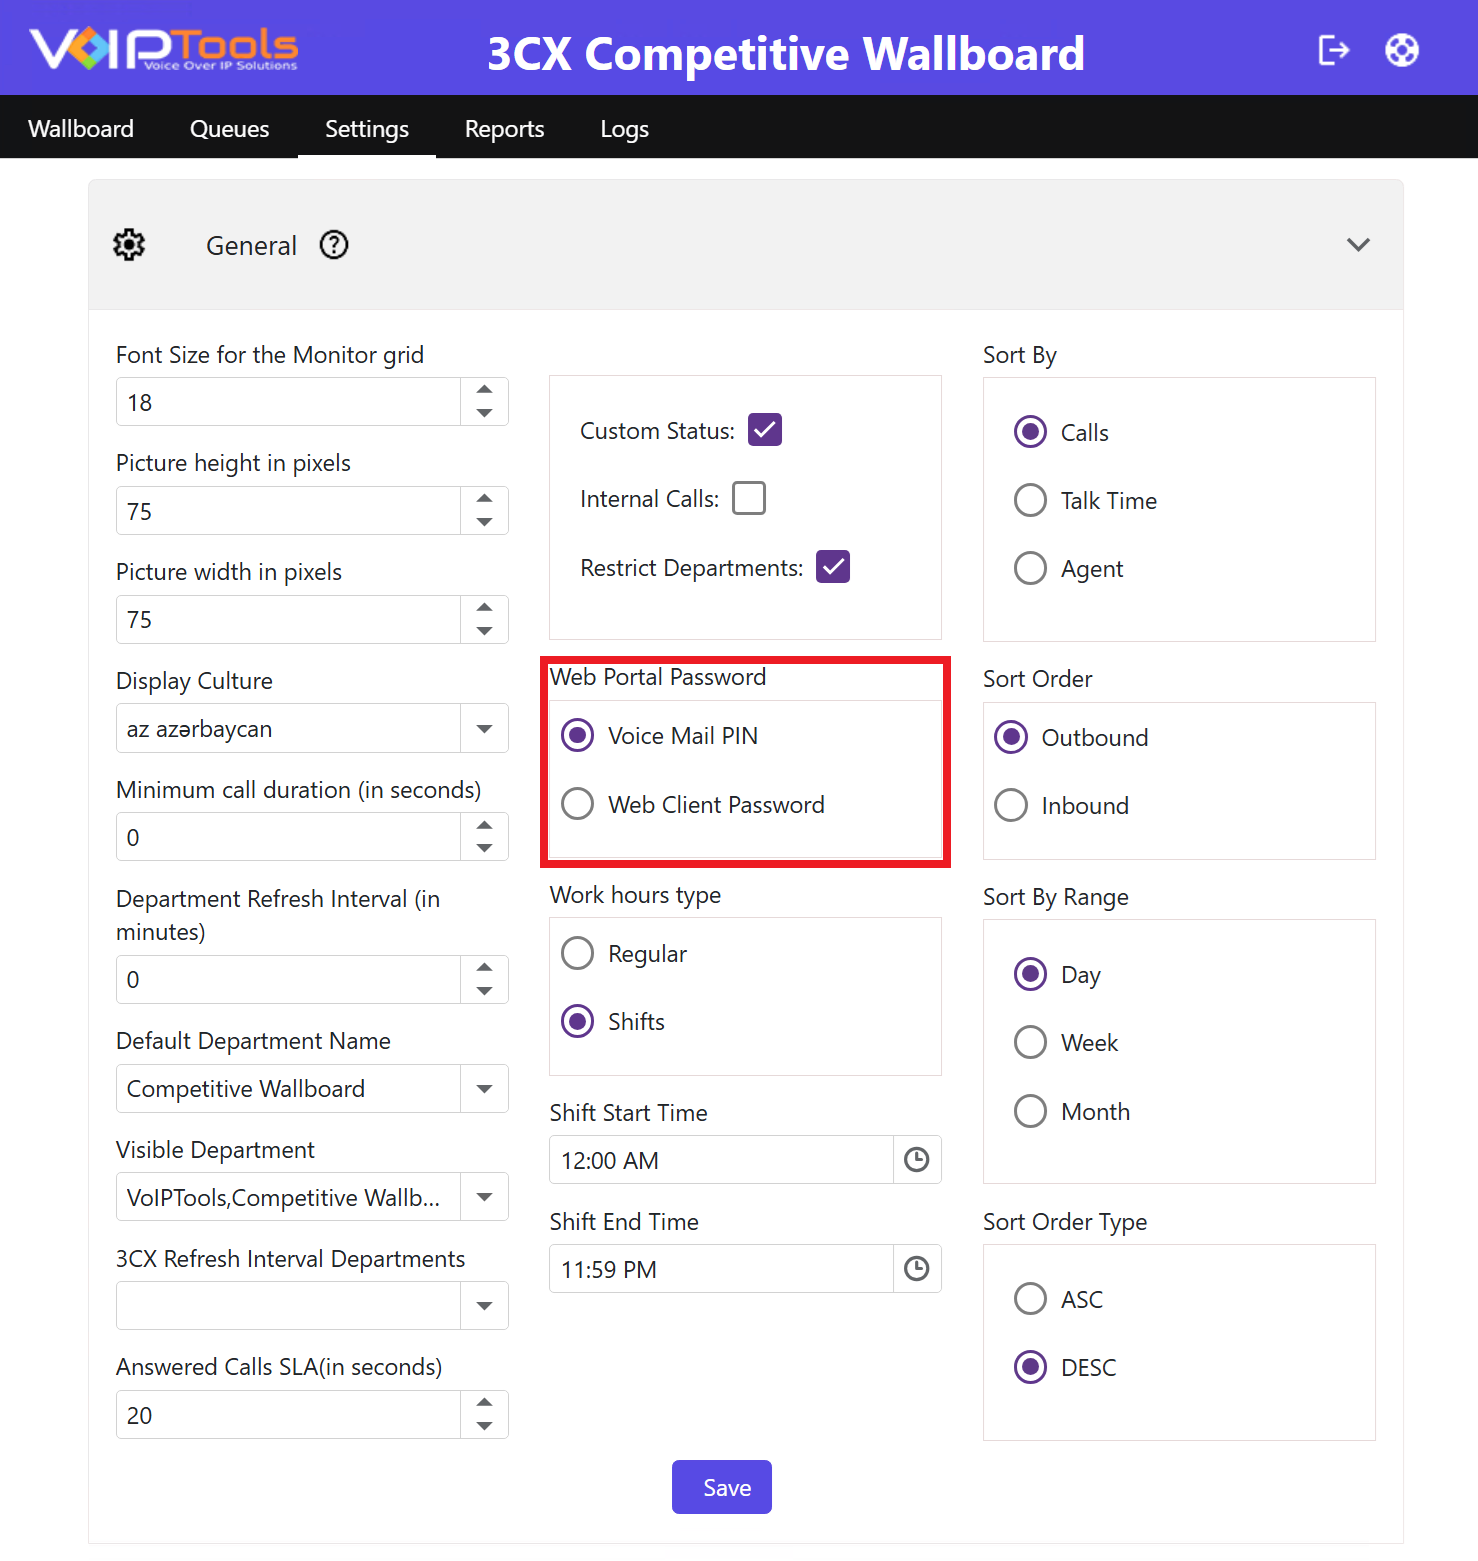 Figure 75: Custom Status, Internal Calls, and Restrict Departments Checkboxes
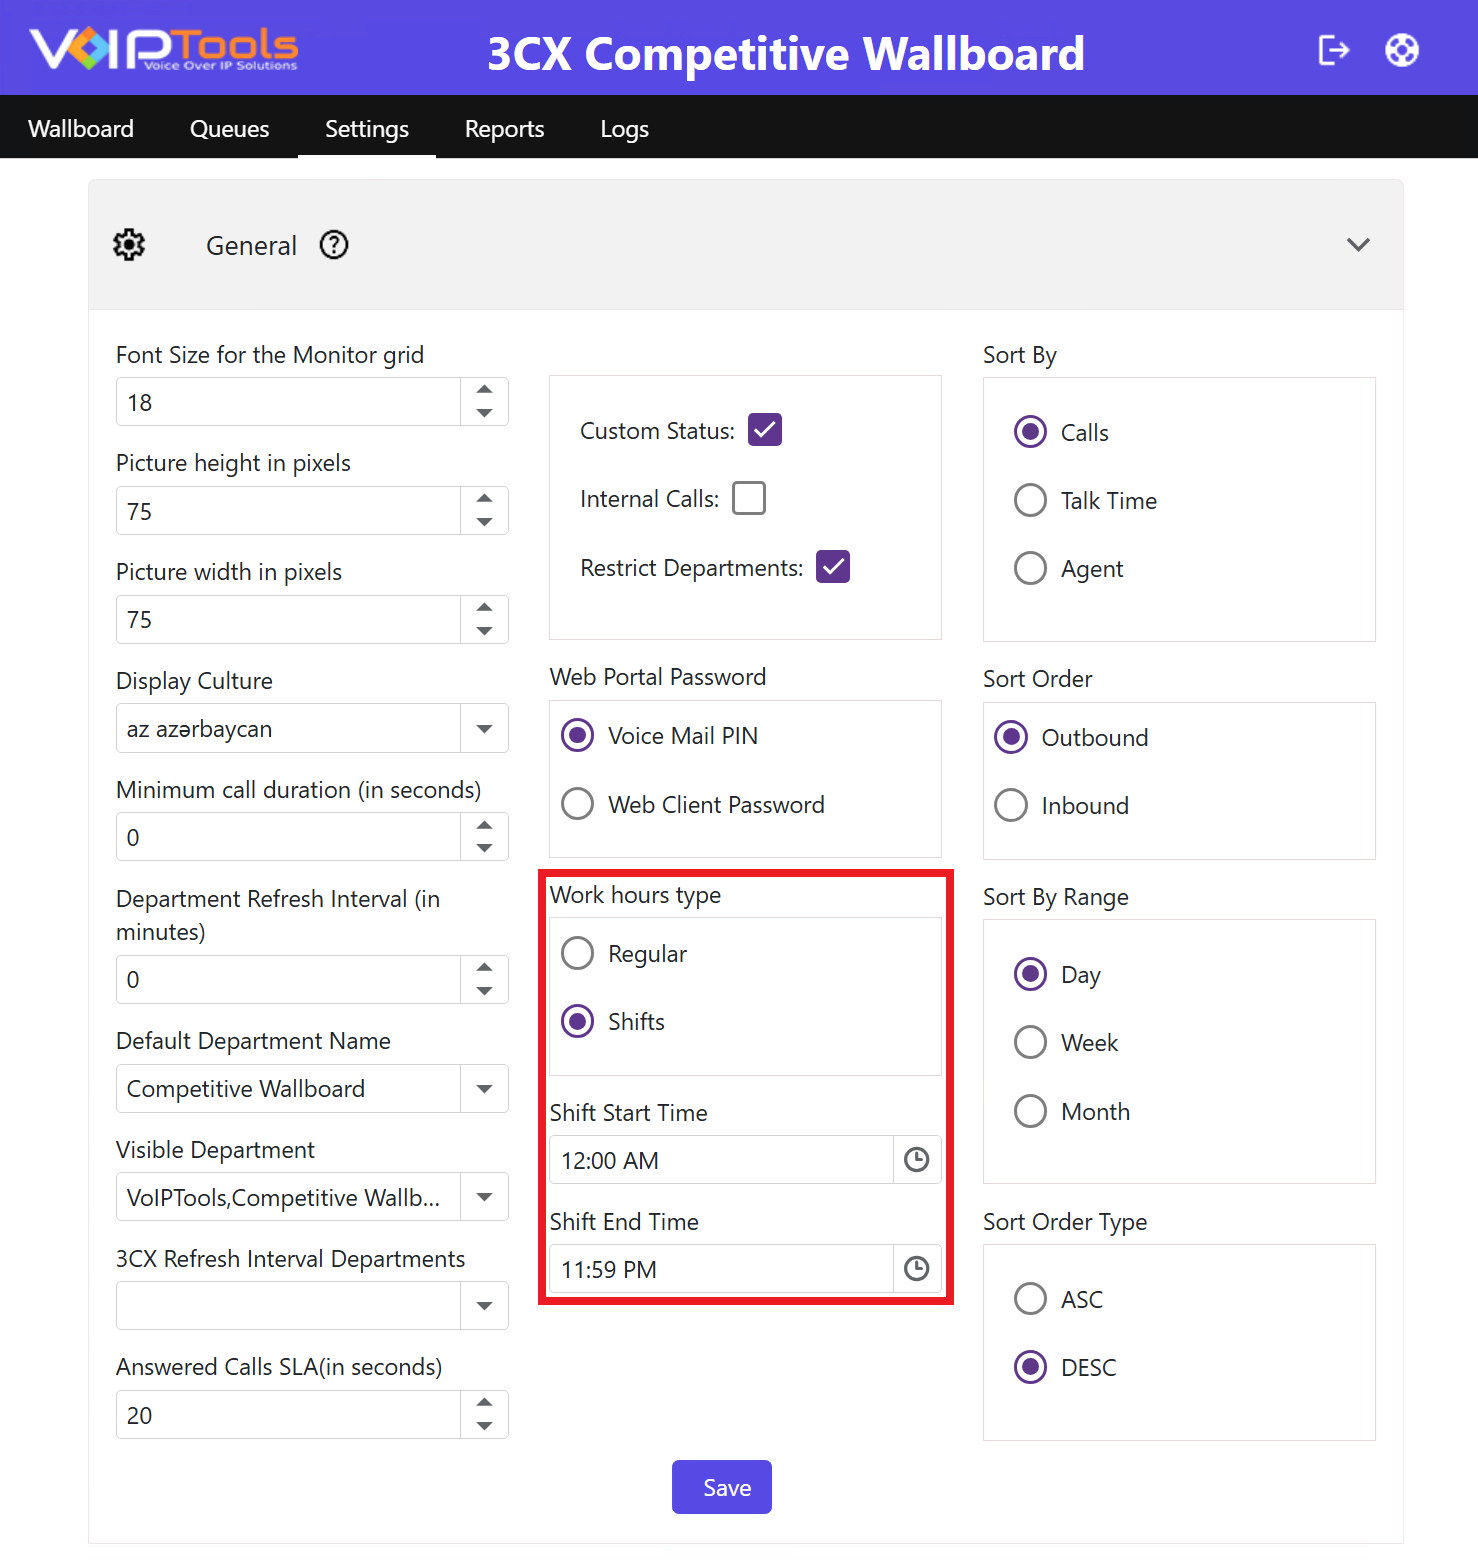 Figure 78: Work Hours Type – Regular and Shift Timings
 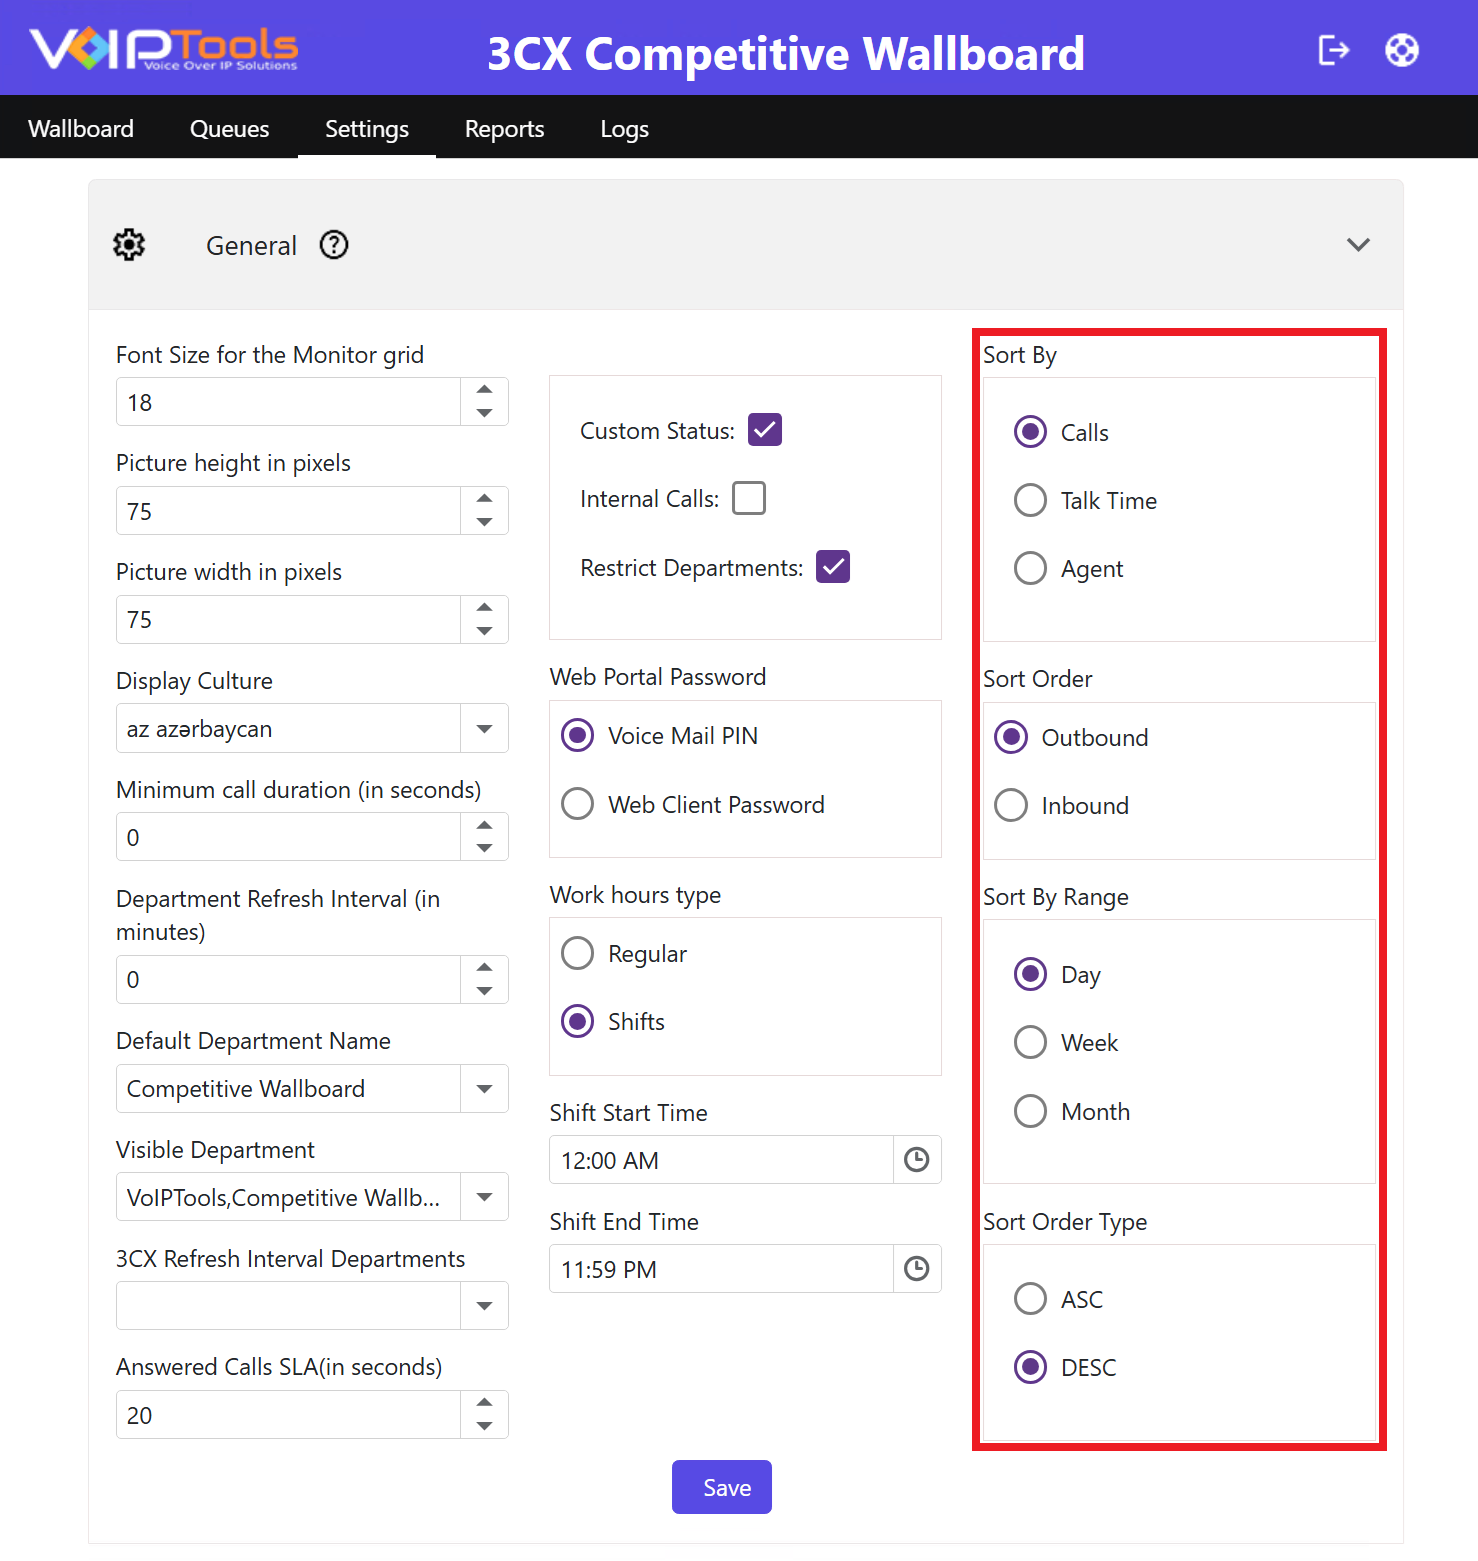 Figure 78: Sort By, Sort Order, Sort By Range, and Sort Order Type Panels
 button to move it to the Available columns list box.
 button to move it to the Display Columns list box.
 button to move the columns up the list or click the Down
  button to move the columns down the list.
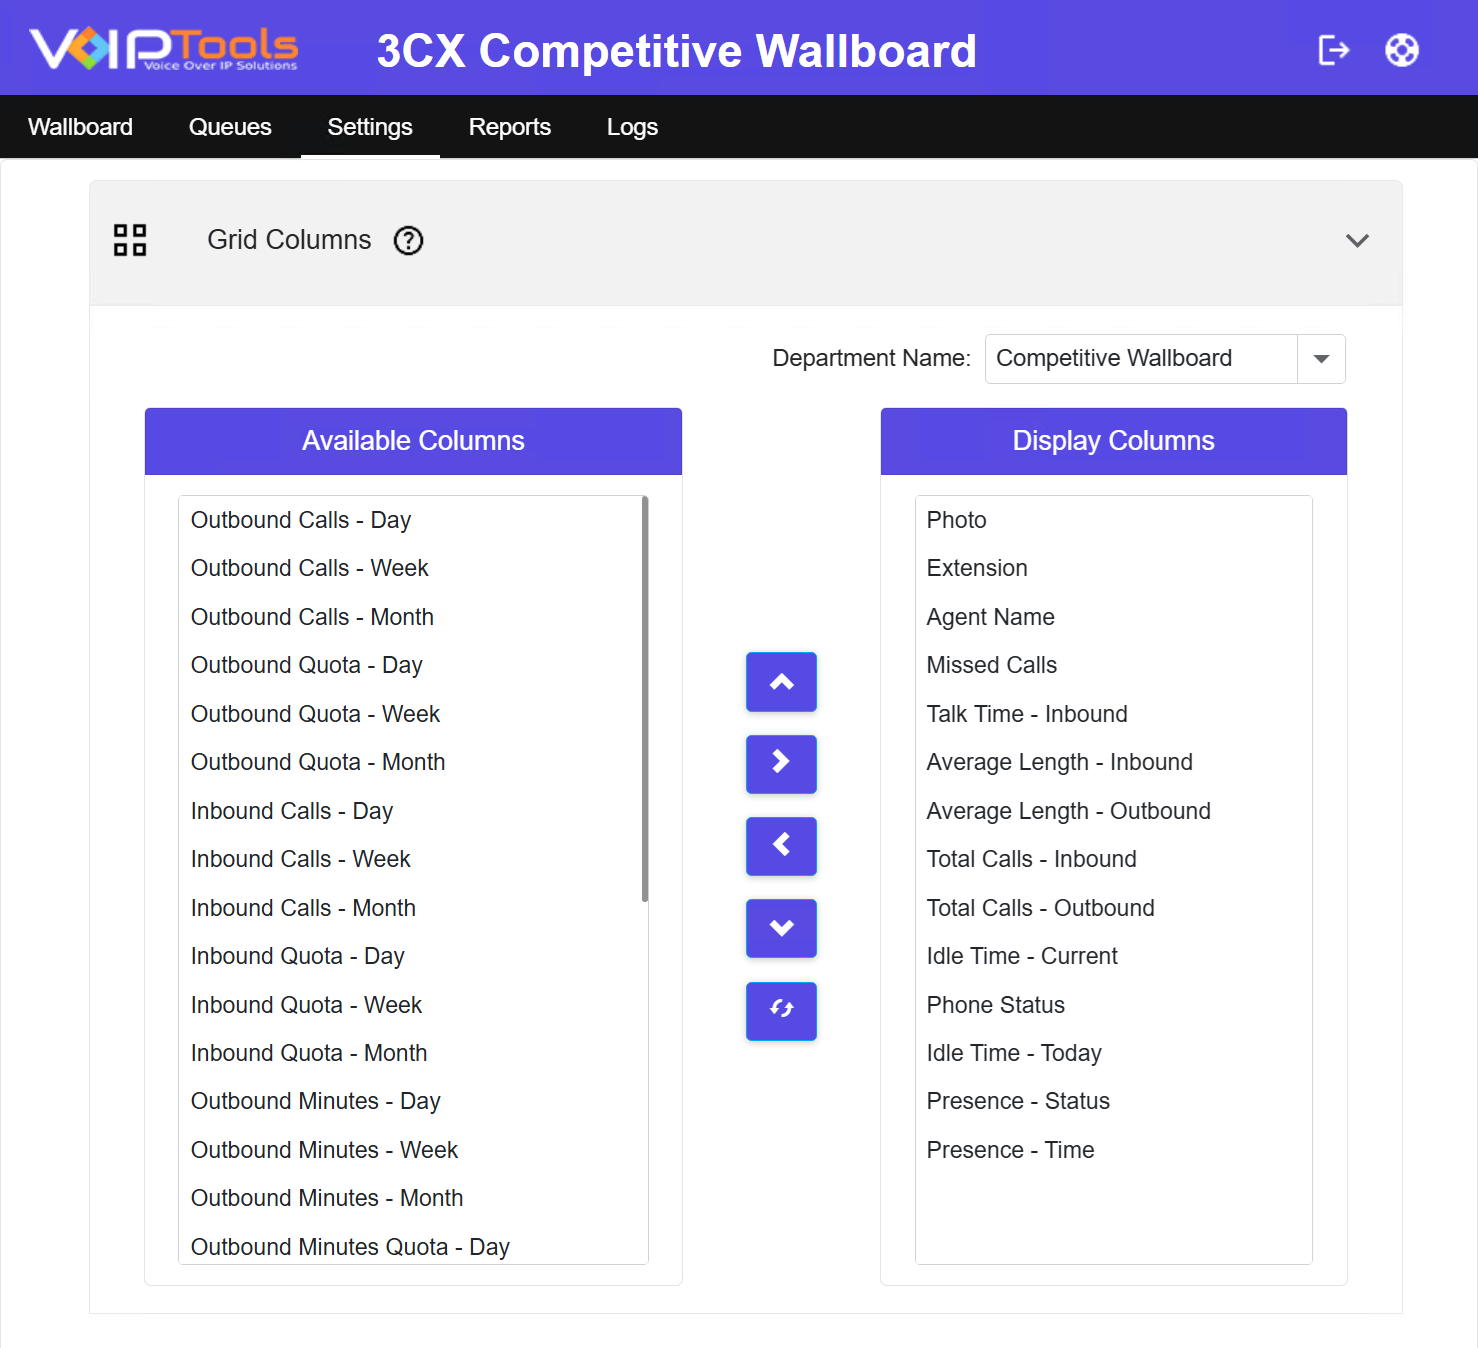
 button to save your settings.
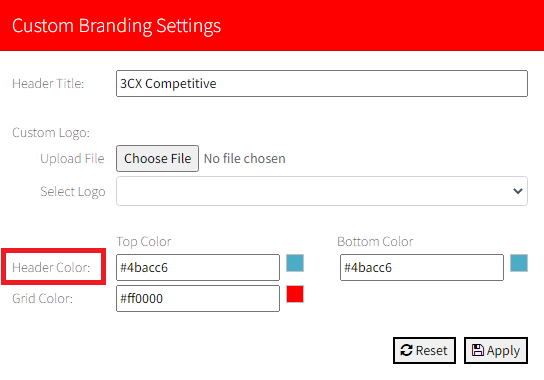

 button to expand the columns.